Fig. 3
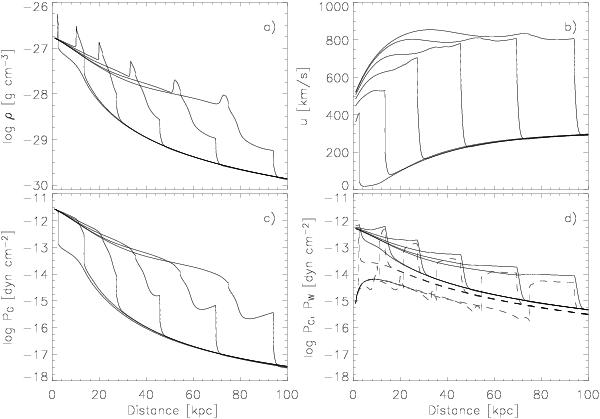
The time-dependent flow structure of a galactic wind up to 100 kpc at six different times at 3.4 × 10⁶, 2.0 × 10⁷, 3.6 × 10⁷, 5.4 × 10⁷, 7.7 × 10⁷ and 1.0 × 10⁸ years. At t = 0 the gas and cosmic ray pressure has been increased by a factor of 10 at the inner boundary of the flux tube, simulating a violent SN-explosion. Panel a) plots the development of the density structure where the forward as well as the reverse shock become visible. The velocity in [km s-1] is depicted in panel b) where the particle acceleration broadens the shock fronts in time. In panels c) and d) the curves correspond to the gas and the cosmic ray pressure (solid line) together with the wave pressure (dashed lines), respectively. The velocities of these features are also plotted in Figs. 4 and 6 (see text for more details).
Current usage metrics show cumulative count of Article Views (full-text article views including HTML views, PDF and ePub downloads, according to the available data) and Abstracts Views on Vision4Press platform.
Data correspond to usage on the plateform after 2015. The current usage metrics is available 48-96 hours after online publication and is updated daily on week days.
Initial download of the metrics may take a while.