Fig. 6
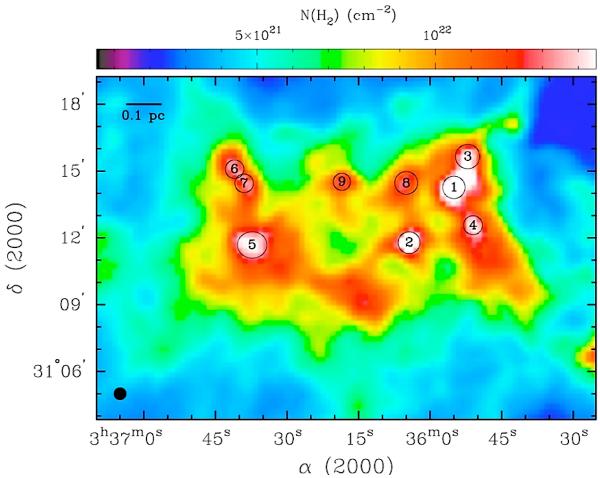
Locations of substructures in B1-E overlaid on our Herschel-derived column density map. Numbers indicate the positions of peak column densities and the relative magnitude of the column density peak (see also Table 1). The thin black circles show the deprojected source sizes (see Sect. 3.3). The dark filled circle shows the GBT beam (~33″) at 23.69 GHz.
Current usage metrics show cumulative count of Article Views (full-text article views including HTML views, PDF and ePub downloads, according to the available data) and Abstracts Views on Vision4Press platform.
Data correspond to usage on the plateform after 2015. The current usage metrics is available 48-96 hours after online publication and is updated daily on week days.
Initial download of the metrics may take a while.