Free Access
Fig. 9
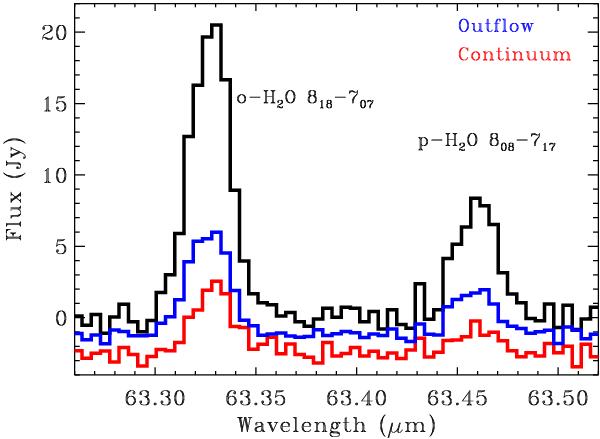
The H2O 63.4 μm spectral region extracted from the on-source position (red) and from the blueshifted outflow position (blue), and over the entire spectral map (black). No significant differences are detected in the ratio of the two lines, which indicate that the two lines are optically thin at both locations.
Current usage metrics show cumulative count of Article Views (full-text article views including HTML views, PDF and ePub downloads, according to the available data) and Abstracts Views on Vision4Press platform.
Data correspond to usage on the plateform after 2015. The current usage metrics is available 48-96 hours after online publication and is updated daily on week days.
Initial download of the metrics may take a while.