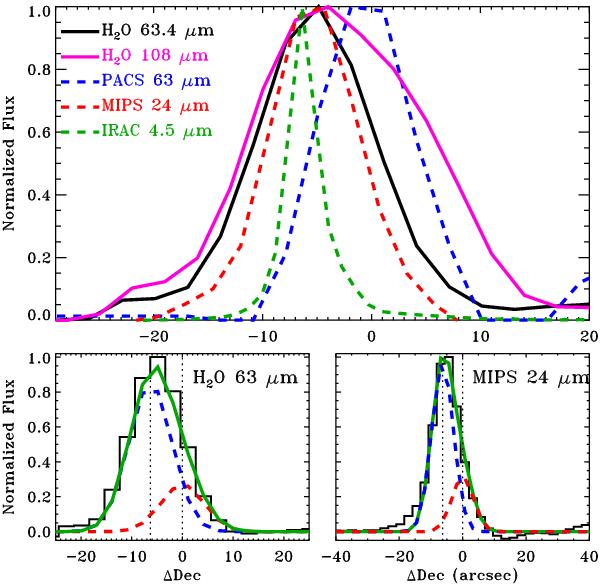
Fig. 8

Top: a cross cut of the flux at several wavelengths along the N-S outflow axis. The 63 μm continuum is centered at the peak of the sub-mm continuum while the 4.5 μm and 24 μm photometry are centered in the outflow. The H2O 63.3 μm lines are produced primarily at the outflow location while the H2O 108.1 μm line has similar on- and off-source contributions. The (0,0) position is defined here by the peak of the sub-mm continuum emission from Jørgensen et al. (2007). Bottom: the spatial cross cut of H2O 63.3 μm and MIPS 24 μm emission, shown as the combination of two unresolved Gaussian profiles located at the on-source position (red dashed line) and the blueshifted outflow position (blue dashed line).
Current usage metrics show cumulative count of Article Views (full-text article views including HTML views, PDF and ePub downloads, according to the available data) and Abstracts Views on Vision4Press platform.
Data correspond to usage on the plateform after 2015. The current usage metrics is available 48-96 hours after online publication and is updated daily on week days.
Initial download of the metrics may take a while.


