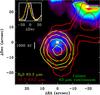
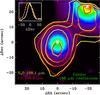
Fig. 6
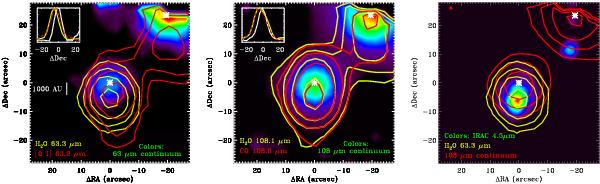
Left and Middle: contour maps of H2O (yellow), [O I] (red, left), and CO (red, middle) emission compared with continuum emission (color contours) at 63.3 μm (left) and 108.5 μm (middle). The insets show the spatial extent of continuum and line emission in the different components along the N-S outflow axis. Right: a comparison of the location of emission in H2O 63.32 μm (blue), 108.5 μm continuum (red), Spitzer-IRAC 4.5 μm photometry (color contours; Jørgensen et al. 2006; Gutermuth et al. 2008). All contours have levels of 0.1,0.2,0.4,0.8, and 1.6 times the peak flux near IRAS 4B. The asterisks show the sub-mm positions of IRAS 4B near the center of the field and IRAS 4A in the NW corner. Some noise in these maps is suppressed at empty locations far from IRAS 4A and IRAS 4B.
Current usage metrics show cumulative count of Article Views (full-text article views including HTML views, PDF and ePub downloads, according to the available data) and Abstracts Views on Vision4Press platform.
Data correspond to usage on the plateform after 2015. The current usage metrics is available 48-96 hours after online publication and is updated daily on week days.
Initial download of the metrics may take a while.