Fig. 4
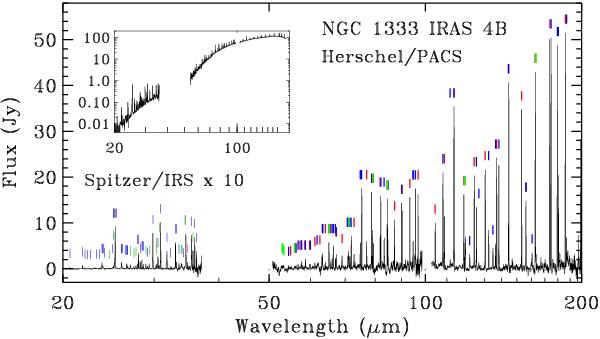
The combined Herschel/PACS and Spitzer/IRS continuum-subtracted spectra of IRAS 4B, with bright emission in many H2O (blue marks), CO (red marks), OH (green marks), and atomic or ionized lines (purple). The Spitzer spectrum is multiplied by a factor of 10 so that the lines are strong enough to be seen on the plot. The inset shows the combined spectrum including the continuum.
Current usage metrics show cumulative count of Article Views (full-text article views including HTML views, PDF and ePub downloads, according to the available data) and Abstracts Views on Vision4Press platform.
Data correspond to usage on the plateform after 2015. The current usage metrics is available 48-96 hours after online publication and is updated daily on week days.
Initial download of the metrics may take a while.