Fig. 3
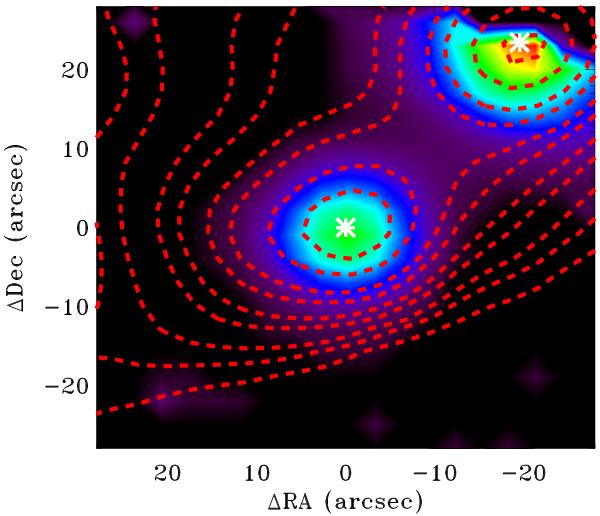
The 63 μm continuum emission (colors) and the SCUBA 450 μm emission map (contours), with the location of IRAS 4A and IRAS 4B marked as white asterisks. The PACS maps are shifted so that the centroid of the 190 μm continuum emission is located at the position of IRAS 4B obtained from sub-mm continuum interferometry. The SCUBA map is shifted to the same position.
Current usage metrics show cumulative count of Article Views (full-text article views including HTML views, PDF and ePub downloads, according to the available data) and Abstracts Views on Vision4Press platform.
Data correspond to usage on the plateform after 2015. The current usage metrics is available 48-96 hours after online publication and is updated daily on week days.
Initial download of the metrics may take a while.