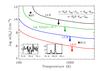
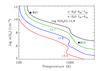
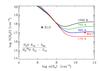
Fig. C.1
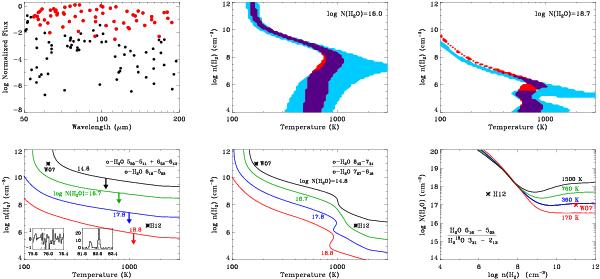
H2O fluxes and acceptable parameter space of temperature and H2 density. The upper left panel shows that in the H12 model, all far-IR H2O lines expected to be strong are detected (red dots), while those expected to be weak are undetected (black dots). Several lines at ~100 μm were likely undetected because the S/N is degraded in that wavelength region. The upper middle panel shows the acceptable contours for flux ratios of o-H2O 818−707/707−616 (blue), o-H2O 707−616/616−505 (red), and both (purple), for two different column densities. The acceptable parameter space shows the 1σ error bars with a 20% relative flux calibration uncertainty. The lower left panel shows that the non-detection of the o-H2O 550−541 and 652−643 lines relative to o-H2O 616 − 505 line places a limit on the optical depth of the slab. The lower middle panel shows where the flux ratio of o-H2O 845−734 35.669 μm to o-H2O 707−616 71.947 μm is equal to the observed value of 0.07. The lower right panel shows the parameter space (high density and high column density) ruled out by the non-detection of the o-H O 321 − 212 line, for four different temperatures.
Current usage metrics show cumulative count of Article Views (full-text article views including HTML views, PDF and ePub downloads, according to the available data) and Abstracts Views on Vision4Press platform.
Data correspond to usage on the plateform after 2015. The current usage metrics is available 48-96 hours after online publication and is updated daily on week days.
Initial download of the metrics may take a while.