Fig. 15
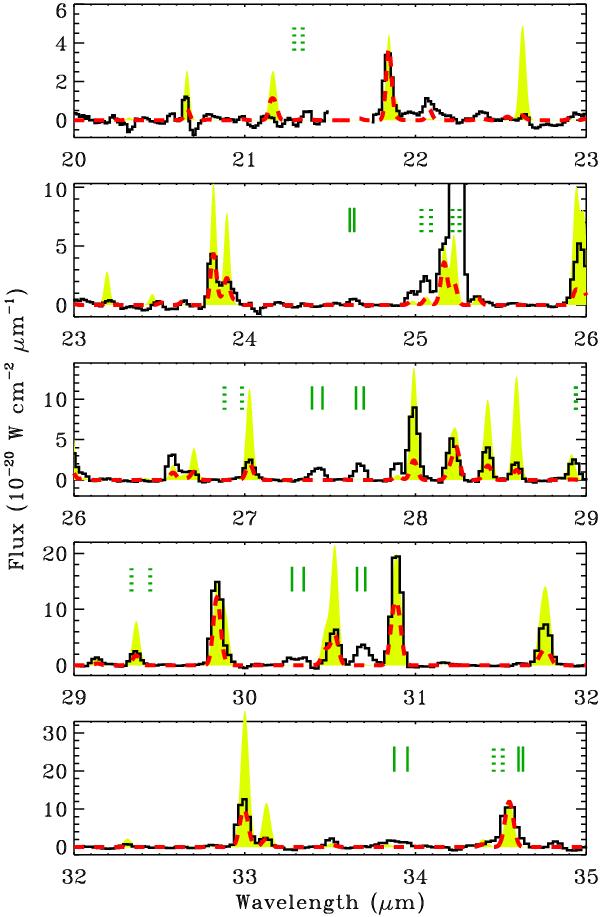
A comparison of H12 (red dashed line, scaled to the flux in the 63.4 μm lines) and W07 (yellow filled regions, scaled to the flux of the 35.5 μm line) model spectra to the Spitzer IRS spectrum. Green vertical lines mark the wavelengths of OH lines that are detected (solid lines) or are too weak or blended to be detected (dotted lines). Both models reproduce most Spitzer/IRS lines reasonably well, with a few exceptions described in detail in the text.
Current usage metrics show cumulative count of Article Views (full-text article views including HTML views, PDF and ePub downloads, according to the available data) and Abstracts Views on Vision4Press platform.
Data correspond to usage on the plateform after 2015. The current usage metrics is available 48-96 hours after online publication and is updated daily on week days.
Initial download of the metrics may take a while.