Free Access
Fig. 13
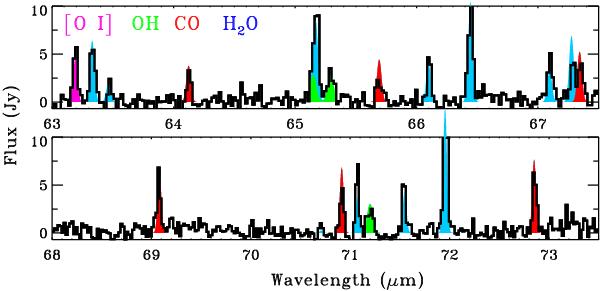
Segments of the PACS spectrum (solid black line). The H2O line fluxes (shaded in blue) are obtained from RADEX, CO line fluxes (red) from the thermal distribution in Fig. 11, and OH (green) and [O I] line fluxes (purple) from Gaussian fits.
Current usage metrics show cumulative count of Article Views (full-text article views including HTML views, PDF and ePub downloads, according to the available data) and Abstracts Views on Vision4Press platform.
Data correspond to usage on the plateform after 2015. The current usage metrics is available 48-96 hours after online publication and is updated daily on week days.
Initial download of the metrics may take a while.