Fig. 12
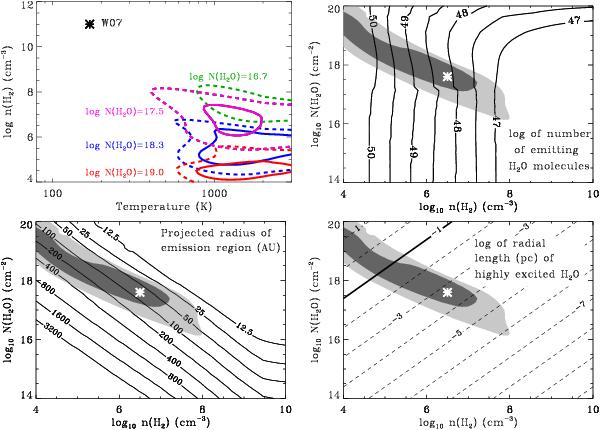
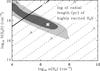
Upper left: contours of χ2 versus temperature and H2 density for several different H2O column densities (the different colors), with the minimum reduced χ2 ~ 4. The contours show where  (solid lines) and 1.5 (dashed lines), which roughly indicate the acceptable parameter space. The contours shown here are calculated to fits of lines with E′ > 400 K. The asterisks show the parameters of the sub-thermal model presented here (H12) and the high density envelope-disk accretion shock model (W07). Upper right and lower panels: contours of total number of H2O molecules (upper right), radius (AU) of a circular emission area for H2O emission (lower left), and length scale (log pc) of H2O emission (lower right) compared with the best fit contours of n(H2) and N(H2O) for T = 1500 K. The asterisks indicate the parameters adopted for this paper. In the lower right panel, the solid line at 0.1 pc shows the conservative upper limit to the length scale of the emission. The parameters adopted for this paper are located in the lower right of the acceptable parameter space so that the length scale for the emission is small.
Current usage metrics show cumulative count of Article Views (full-text article views including HTML views, PDF and ePub downloads, according to the available data) and Abstracts Views on Vision4Press platform.
Data correspond to usage on the plateform after 2015. The current usage metrics is available 48-96 hours after online publication and is updated daily on week days.
Initial download of the metrics may take a while.