Fig. 11
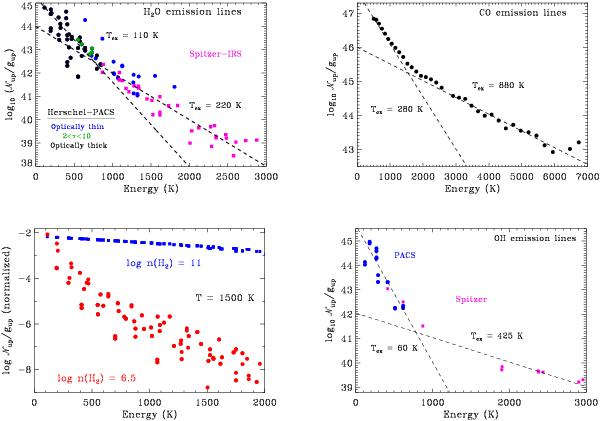
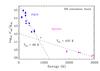
Excitation diagrams, in units of total number of detected molecules  divided by degeneracy g, for H2O (upper left), CO (upper right), and OH (lower right) emission lines detected with Herschel-PACS (circles) and Spitzer-IRS (purple squares). For the H2O excitation diagram, PACS data are subdivided into lines that are optically-thin (blue), moderately optically-thick (green), and optically-thick (black), for the H12 model. Most of the Spitzer lines are optically-thin. Lower left: H2O excitation diagrams obtained from RADEX models for optically thin models with T = 1500 K at high (blue) and low (red) density. At low density, subthermal excitation leads to cooler measured excitation temperatures and significant scatter in the level populations.
Current usage metrics show cumulative count of Article Views (full-text article views including HTML views, PDF and ePub downloads, according to the available data) and Abstracts Views on Vision4Press platform.
Data correspond to usage on the plateform after 2015. The current usage metrics is available 48-96 hours after online publication and is updated daily on week days.
Initial download of the metrics may take a while.