Fig. 1
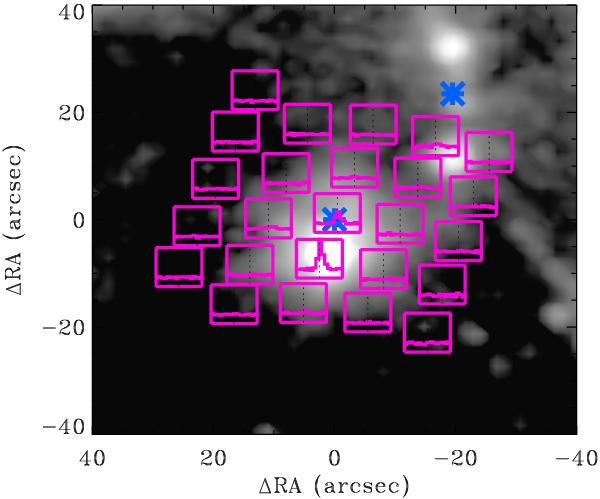
The location of the 5 × 5 spaxel array (purple spectral map) against an 4.5 μm image obtained with Spitzer/IRAC (grayscale) from Jørgensen et al. (2006). The spectral map shows that the continuum-subtracted emission in the o-H2O 616−505 82.03 μm (E′ = 643 K) line is produced mostly in the blueshifted outflow lobe. The sub-mm positions of IRAS 4B and IRAS 4A are marked with blue asterisks.
Current usage metrics show cumulative count of Article Views (full-text article views including HTML views, PDF and ePub downloads, according to the available data) and Abstracts Views on Vision4Press platform.
Data correspond to usage on the plateform after 2015. The current usage metrics is available 48-96 hours after online publication and is updated daily on week days.
Initial download of the metrics may take a while.