Fig. 9
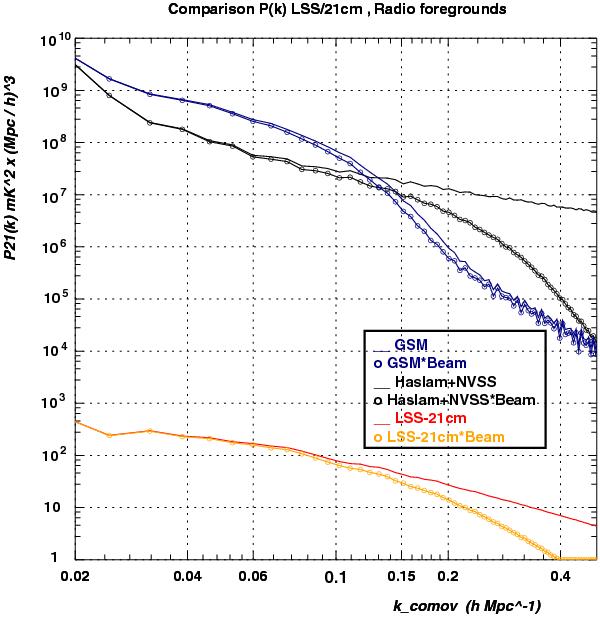
Comparison of the 21 cm LSS power spectrum at z = 0.6 with fHI ≃ 1.3% (red, orange) with the radio foreground power spectrum. The radio sky power spectrum is shown for the GSM (Model-I) sky model (dark blue), as well as for our simple model based on Haslam+NVSS (Model-II, black). The curves with circle markers show the power spectrum as observed by a perfect instrument with a 25 arcmin (FWHM) Gaussian beam.
Current usage metrics show cumulative count of Article Views (full-text article views including HTML views, PDF and ePub downloads, according to the available data) and Abstracts Views on Vision4Press platform.
Data correspond to usage on the plateform after 2015. The current usage metrics is available 48-96 hours after online publication and is updated daily on week days.
Initial download of the metrics may take a while.