Fig. 16
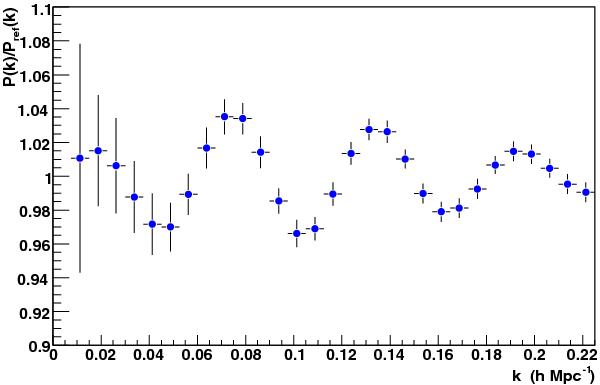
1D projection of the power spectrum averaged over 100 simulations of the packed dish array. The simulations are performed for the following conditions: a system temperature Tsys = 50 K, an observation time Tobs = 1 year, a solid angle of 1πsr, an average redshift z = 1.5, and a redshift depth Δz = 0.5. The HI power spectrum is divided by an envelop curve P(k)ref corresponding to the power spectrum without baryonic oscillations, and the background estimated by a fit is subtracted. The errors are the rms of the 100 distributions for each k bin, and the dots are the mean of the distribution for each k bin.
Current usage metrics show cumulative count of Article Views (full-text article views including HTML views, PDF and ePub downloads, according to the available data) and Abstracts Views on Vision4Press platform.
Data correspond to usage on the plateform after 2015. The current usage metrics is available 48-96 hours after online publication and is updated daily on week days.
Initial download of the metrics may take a while.