Fig. 12
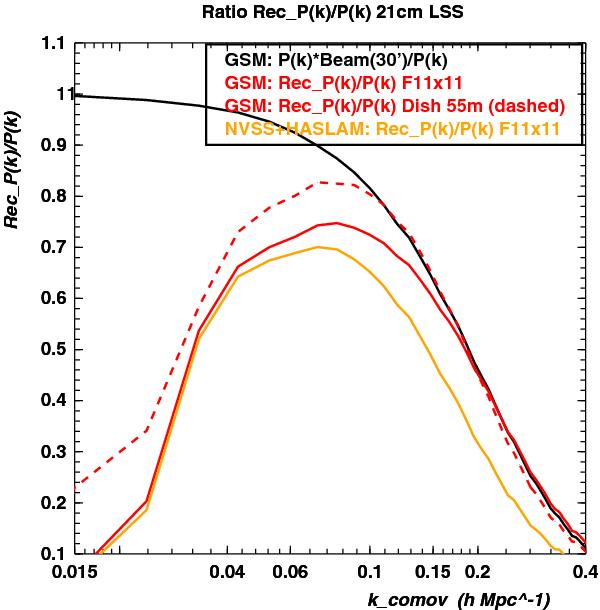
Ratio of the reconstructed or extracted 21 cm power spectrum, after foreground removal, to the initial 21 cm power spectrum,  (transfer function), at z ~ 0.6 for the instrument configuration (a), 11 × 11 packed array interferometer. The effect of a frequency-independent Gaussian beam of ~ 30′ is shown in black. The transfer function T(k) for the instrument configuration (a), 11 × 11 packed array interferometer, for the GSM/Model-I is shown in red, and in orange for Haslam+NVSS/Model-II. The transfer function for a D = 55 m diameter dish for the GSM model is also shown as the dashed red curve.
Current usage metrics show cumulative count of Article Views (full-text article views including HTML views, PDF and ePub downloads, according to the available data) and Abstracts Views on Vision4Press platform.
Data correspond to usage on the plateform after 2015. The current usage metrics is available 48-96 hours after online publication and is updated daily on week days.
Initial download of the metrics may take a while.