Fig. 10
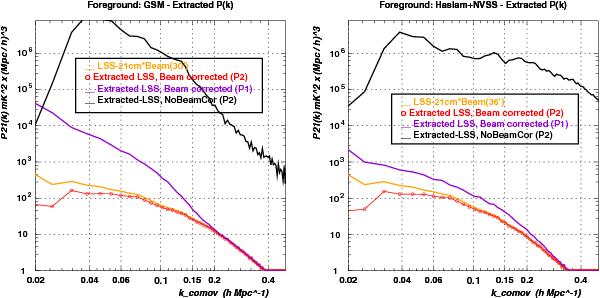
Recovered power spectrum of the 21 cm LSS temperature fluctuations, separated from the continuum radio emissions at z ~ 0.6, fHI ≃ 1.3%, for the instrument configuration (a), 11 × 11 packed array interferometer. Left: GSM/Model-I, right: Haslam+NVSS/Model-II. The black curve shows the residual after foreground subtraction, corresponding to the 21 cm signal, WITHOUT applying the beam correction. The red curve shows the recovered 21 cm signal power spectrum, for P2 type fit of the frequency dependence of the radio continuum, and violet curve is the P1 fit (see text). The orange curve shows the original 21 cm signal power spectrum, smoothed with a perfect, frequency-independent Gaussian beam.
Current usage metrics show cumulative count of Article Views (full-text article views including HTML views, PDF and ePub downloads, according to the available data) and Abstracts Views on Vision4Press platform.
Data correspond to usage on the plateform after 2015. The current usage metrics is available 48-96 hours after online publication and is updated daily on week days.
Initial download of the metrics may take a while.