Fig. 6
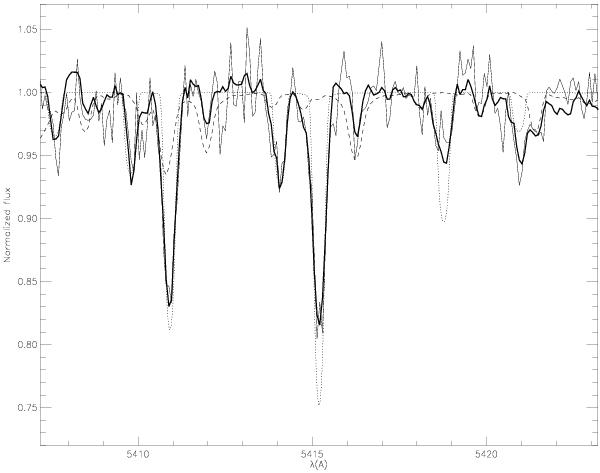
Individual (thin line) and summed (thick line) normalized spectrum of the periastron night around one of the selected lines (Fe I 5415.1920 Å). Synthetic spectra with Teff = 8500 K (dotted line) and Teff = 4750 K (dashed line) were overplotted (log g = 4.0, vmicro = 2 km s-1 solar abundances for both spectra), showing the location of the individual lines. The secondary’s spectrum was corrected by the local luminosity ratio. Neither fundamental parameters nor local luminosity ratios are perfectly tuned at this stage.
Current usage metrics show cumulative count of Article Views (full-text article views including HTML views, PDF and ePub downloads, according to the available data) and Abstracts Views on Vision4Press platform.
Data correspond to usage on the plateform after 2015. The current usage metrics is available 48-96 hours after online publication and is updated daily on week days.
Initial download of the metrics may take a while.