Free Access
Fig. 3
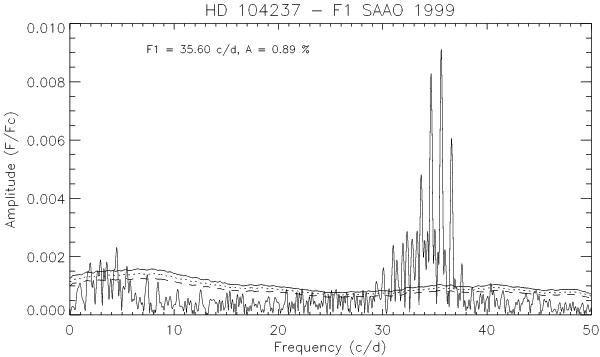
Periodogram of the line center variation as shown in Fig. 2, without prewithening. The large bulk of frequencies around 29-36 d-1can be seen, as well as the 3.2, 3.6 and 4.0 mean-ampitude level of the noise determined by prewithening F1 to F9, corresponding to a 90%, 99% and 99.9% significance level, respectively.
Current usage metrics show cumulative count of Article Views (full-text article views including HTML views, PDF and ePub downloads, according to the available data) and Abstracts Views on Vision4Press platform.
Data correspond to usage on the plateform after 2015. The current usage metrics is available 48-96 hours after online publication and is updated daily on week days.
Initial download of the metrics may take a while.