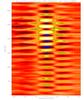
Fig. 1
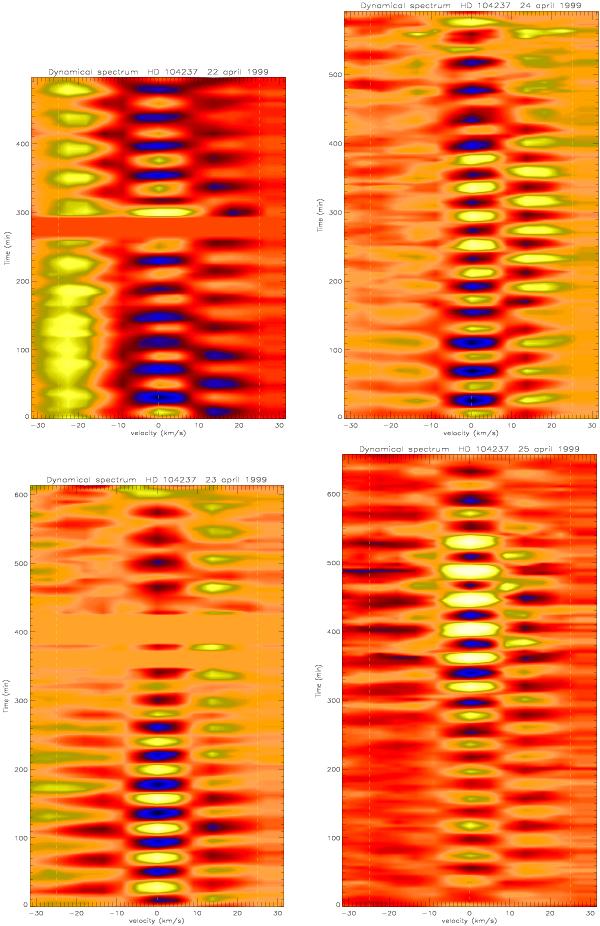
Line profile variations due to the non-radial pulsations of HD 104237. The deviations from the mean intensity are displayed for four different nights (top left: April 22, 1999, bottom left: April 23, 1999, top right: April 24, 1999, bottom right: April 25, 1999). Dashed lines represent the limits of the equivalent profile, an additional broadening agent generates wings reaching almost ± 2 vsini, i.e. twice the width of a pure rotational profile at continuum level.
Current usage metrics show cumulative count of Article Views (full-text article views including HTML views, PDF and ePub downloads, according to the available data) and Abstracts Views on Vision4Press platform.
Data correspond to usage on the plateform after 2015. The current usage metrics is available 48-96 hours after online publication and is updated daily on week days.
Initial download of the metrics may take a while.