Fig. 2
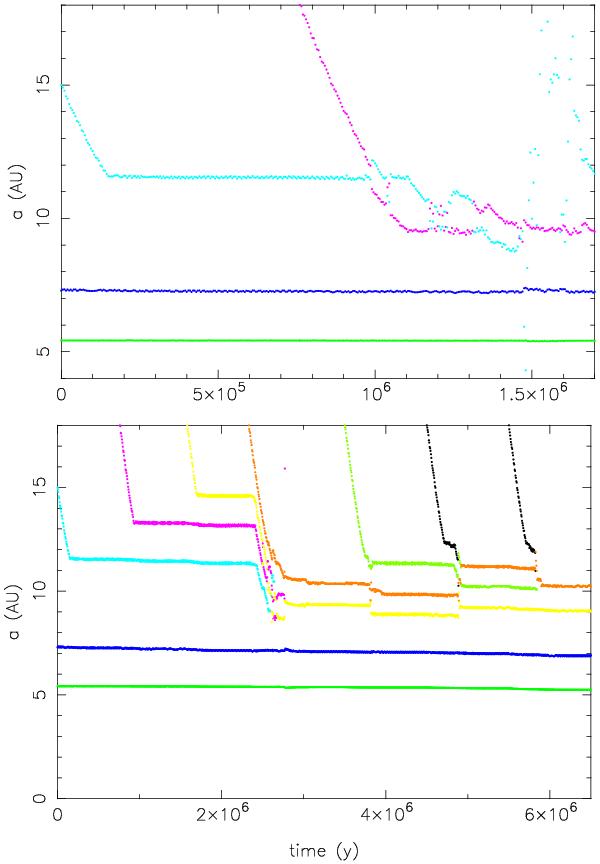
Simulations of the dynamical evolution of embryos in the disk outside of Saturn’s orbit. Top: a case with parameters fd = fI = 1. Bottom: a case with fd = fI = 2. The green and blue curves at ~ 5.4 and ~ 7.3 AU show the semi-major axis evolution of Jupiter and Saturn, respectively. The other curves of various colors illustrate the evolution of the semi-major axes of the embryos. See text for a description of the dynamical evolution and the accretion events.
Current usage metrics show cumulative count of Article Views (full-text article views including HTML views, PDF and ePub downloads, according to the available data) and Abstracts Views on Vision4Press platform.
Data correspond to usage on the plateform after 2015. The current usage metrics is available 48-96 hours after online publication and is updated daily on week days.
Initial download of the metrics may take a while.