Fig. A.3
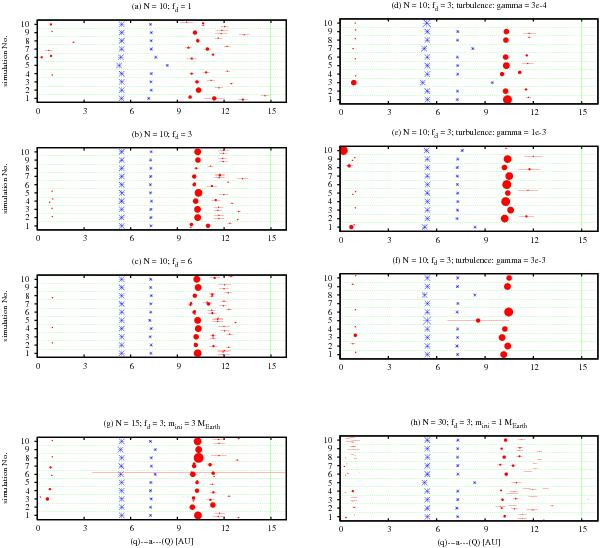
Same as Fig. A.1 but for the simulations in which the planet trap was considered. The plots a)–c) show the end-states starting with initial embryo-mass of 3 M⊕ when the turbulence is not taken into account, plots d)–f) are related to the cases with the turbulence characterized by γ = 3 × 10⁻⁴, 1 × 10⁻³, and 3 × 10⁻³, respectively. At the start, ten embryos are assumed in these simulations. Plot g) shows the end-states of simulations starting with a higher total mass (15 embryos of 3 M⊕) and plot h) does this for a larger number of initally less massive embryos (30 embryos of 1 M⊕). (For the discussion – see Sect. 5.)
Current usage metrics show cumulative count of Article Views (full-text article views including HTML views, PDF and ePub downloads, according to the available data) and Abstracts Views on Vision4Press platform.
Data correspond to usage on the plateform after 2015. The current usage metrics is available 48-96 hours after online publication and is updated daily on week days.
Initial download of the metrics may take a while.