Fig. A.1
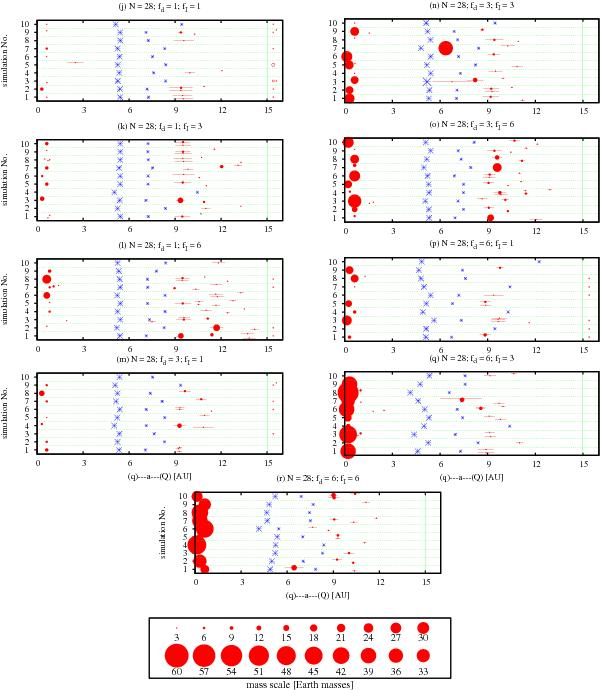
End-states (in 5 Myr) of the simulations starting with 28 embryos, each with 3 M⊕. The simulations are separated by horizontal dashed green lines. The surviving embryos/cores are shown with filled red dots, whose size is proportional to the objects’ mass. The scale is shown in the bottom panel. The red horizontal bar shows the perihelion-aphelion excursion of these objects on their eccentric orbits. The objects beyond 15 AU are plotted for simplicity at 15.5 AU, beyond the vertical solid green line. Jupiter and Saturn are shown as blue asterisks. The label on top of each panel reports the number N of embryos and the values of fI and fd adopted in the simulations. (For the discussion – see Sect. 4.)
Current usage metrics show cumulative count of Article Views (full-text article views including HTML views, PDF and ePub downloads, according to the available data) and Abstracts Views on Vision4Press platform.
Data correspond to usage on the plateform after 2015. The current usage metrics is available 48-96 hours after online publication and is updated daily on week days.
Initial download of the metrics may take a while.