Fig. 1
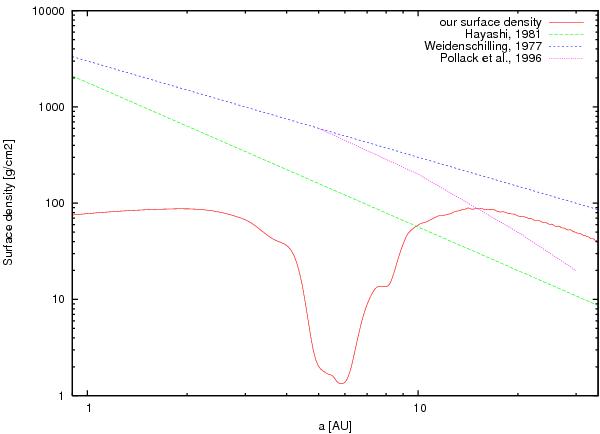
Gas surface densities according to different works. The red curve shows the result of the hydro-dynamical simulation by Morbidelli & Crida (2007), with Jupiter and Saturn in 2:3 resonance. This is the profile that we assumed in this paper, possibly scaled by a factor fd. The blue line is from Weidenschilling (1977) and is proportional to 1/r. The green line is from Hayashi (1981) and is proportional to 1/r3/2. The magenta curve reports the amount of gas required in the Pollack et al. (1996) model of giant planet accretion.
Current usage metrics show cumulative count of Article Views (full-text article views including HTML views, PDF and ePub downloads, according to the available data) and Abstracts Views on Vision4Press platform.
Data correspond to usage on the plateform after 2015. The current usage metrics is available 48-96 hours after online publication and is updated daily on week days.
Initial download of the metrics may take a while.