Fig. 8
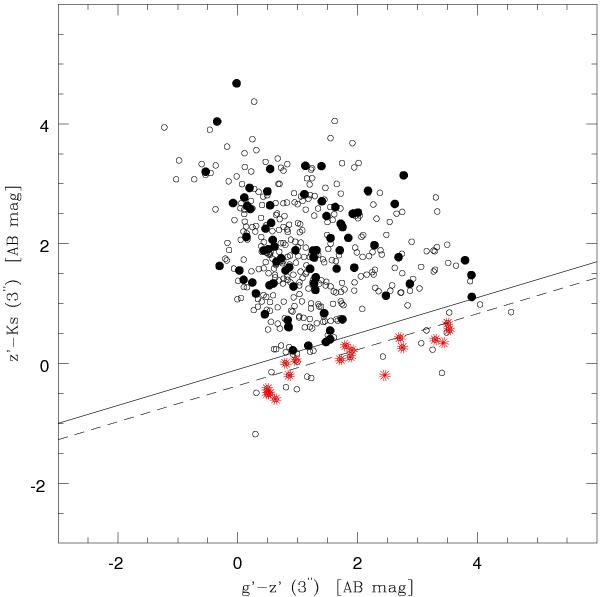
Distribution of all sources with fluxes in the GROND g′,z′,Ks channels above the respective 1σ thresholds in the z′ − Ks vs. g′ − z′ colour − colour diagram. Magnitudes within a 3′′-wide circular aperture are used. Sources identified as point-like on the basis of a SExtractor stellarity index larger than 0.98 are marked with red asterisks. Conversely, extended sources within (beyond) 1′ from the position of XMMU J0338.7 + 0030 are marked with filled (empty) circles. The short-dashed and solid lines represent, respectively, the computed and adopted thresholds to select bona fide stars (see text).
Current usage metrics show cumulative count of Article Views (full-text article views including HTML views, PDF and ePub downloads, according to the available data) and Abstracts Views on Vision4Press platform.
Data correspond to usage on the plateform after 2015. The current usage metrics is available 48-96 hours after online publication and is updated daily on week days.
Initial download of the metrics may take a while.