Fig. 4
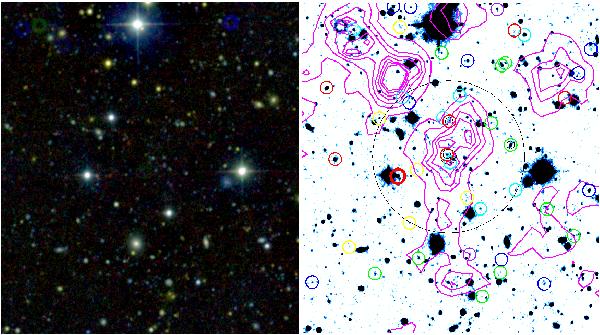
J,z′,g′ colour-composite image of the 3.9 × 4.3 arcmin2 region of XMMU J0338.7 + 0030 mapped with GROND at all seven bands (left panel). North is up and east to the left. The corresponding z′-image (right panel) illustrates the 2-D distribution of the 44 sources in the GROND photometric sample with a photo-z that is consistent with the spectroscopic redshift, i.e., at 1.01 ≤ z ≤ 1.23 (empty circles). These 44 photometric members are colour-coded according to their spectro-photometric classification as E (red), Sbc (yellow), Scd (green), Im (cyan), SB (blue) or QSO (purple). The three spectroscopic members among them are marked with small, black empty circles. Two concentric black circles with radii of 6′′ and 60′′ mark the X-ray position and bona fide region of XMMU J0338.7 + 0030, respectively. Magenta contours represent the weak, marginally extended X-ray emission of the source determined in Sect. 2.1.2. This emission is consistent with the projected distribution of the photometric cluster members. However, the candidate BCG (thick red empty circle) is offset by ~ 43′′ towards the east-south-east.
Current usage metrics show cumulative count of Article Views (full-text article views including HTML views, PDF and ePub downloads, according to the available data) and Abstracts Views on Vision4Press platform.
Data correspond to usage on the plateform after 2015. The current usage metrics is available 48-96 hours after online publication and is updated daily on week days.
Initial download of the metrics may take a while.