Fig. 14
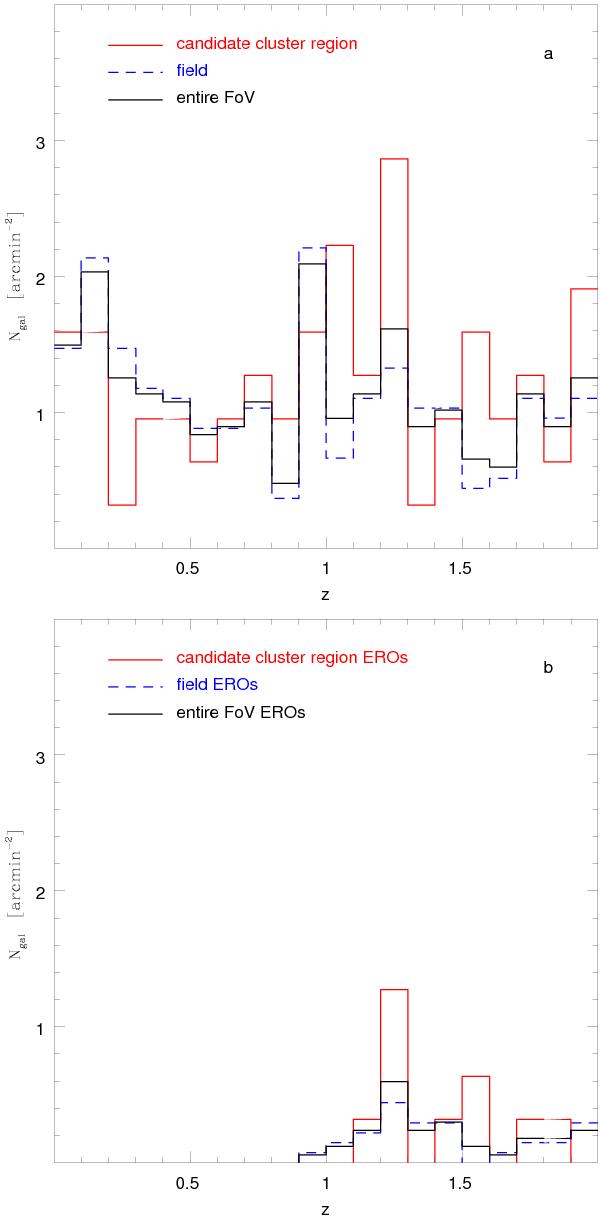
Number density as a function of the photometric redshift for the extragalactic sources with a photo-z less than 2 in the entire 3.9 × 4.3 arcmin2 region of the sky imaged with GROND (black solid line), for those among them inside the bona fide cluster area (red solid line) or in the surrounding field (blue short-dashed line) – panel a). The analogous distribution functions for the sub-sample of EROs, expected to be at z ~ 1−2 (see text), are also reproduced (panel b)). For the redshift bins 1.0–1.1, 1.2–1.3 and 1.5–1.6, the density of sources within a cluster-centric distance of 1′ exceeds that computed in the adjacent field by a factor of 2. In correspondence of the last two redshift bins, there is a clear excess of EROs.
Current usage metrics show cumulative count of Article Views (full-text article views including HTML views, PDF and ePub downloads, according to the available data) and Abstracts Views on Vision4Press platform.
Data correspond to usage on the plateform after 2015. The current usage metrics is available 48-96 hours after online publication and is updated daily on week days.
Initial download of the metrics may take a while.