Free Access
Fig. 11
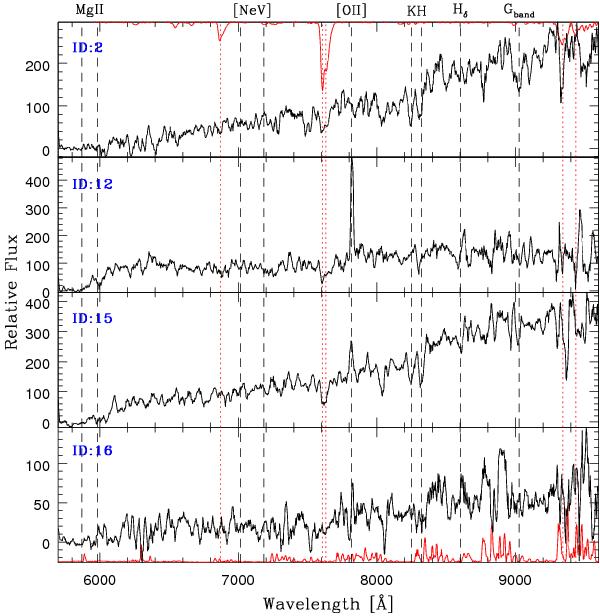
Spectra of the four cluster members smoothed with a seven-pixel boxcar filter. Black, dashed lines indicate the expected positions of prominent spectral features at z = 1.1. Features caused by telluric absorption (top panel) or sky emission (bottom panel) are plotted in red.
Current usage metrics show cumulative count of Article Views (full-text article views including HTML views, PDF and ePub downloads, according to the available data) and Abstracts Views on Vision4Press platform.
Data correspond to usage on the plateform after 2015. The current usage metrics is available 48-96 hours after online publication and is updated daily on week days.
Initial download of the metrics may take a while.