Fig. 1
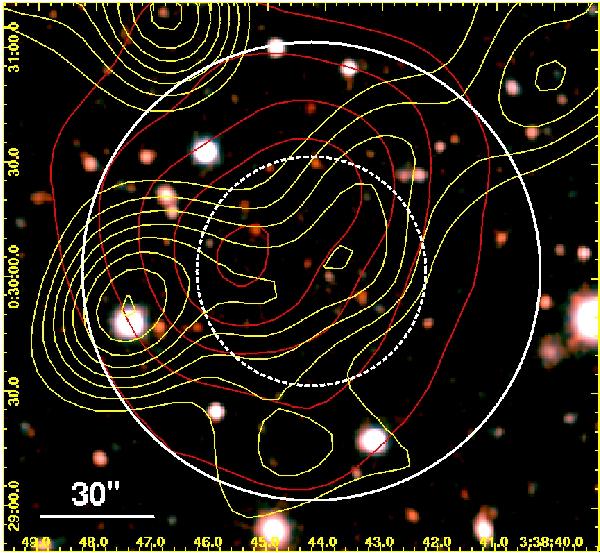
A z + H colour composite image (4.5′ on the side) of the environment of XMMU J0338.7+0030 with an overlaid contour map of the X-ray emission detected by XMM-Newton (in yellow). These log-spaced X-ray contours correspond to significance levels of 2 − 16σ; they were derived from the adaptively smoothed, combined images of the cluster environment. Red contours highlight the over-density of galaxies with very red z − H colours (3.0 ≤ z − H ≤ 4.8 Vega mag), as obtained from the OMEGA2000 imaging (see Sect. 2.2.2). White dashed and solid lines encircle regions within 30′′ and 60′′ from the X-ray centroid of the cluster (RA(J2000.0): 03h38m44.2s, Dec(J2000.0): + 00d30m01.8s), respectively; they guide the eye. The red contour closest to the X-ray position of the cluster corresponds to a significance of 4.6σ above the mean background.
Current usage metrics show cumulative count of Article Views (full-text article views including HTML views, PDF and ePub downloads, according to the available data) and Abstracts Views on Vision4Press platform.
Data correspond to usage on the plateform after 2015. The current usage metrics is available 48-96 hours after online publication and is updated daily on week days.
Initial download of the metrics may take a while.