Fig. 7
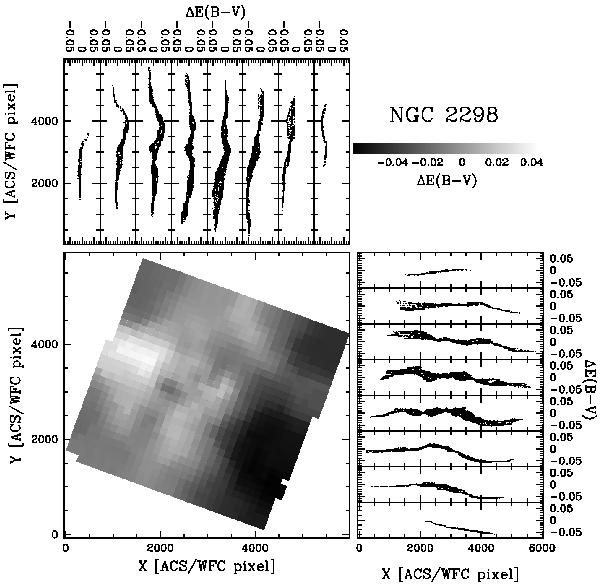
Bottom-left: map of differential reddening in the NGC 2298 field of view. The gray levels correspond to the magnitude of the variation in local reddening as indicated in the upper-right panel. We divided the field of view into 8 horizontal slices and 8 vertical slices. Upper-left and lower-right panels plot Δ E(B − V) as a function of the Y and X coordinate.
Current usage metrics show cumulative count of Article Views (full-text article views including HTML views, PDF and ePub downloads, according to the available data) and Abstracts Views on Vision4Press platform.
Data correspond to usage on the plateform after 2015. The current usage metrics is available 48-96 hours after online publication and is updated daily on week days.
Initial download of the metrics may take a while.