Fig. B.4
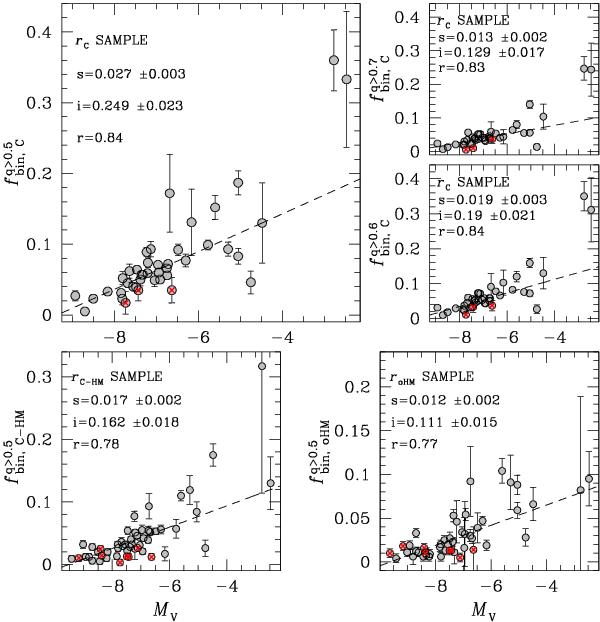
Upper-left: fraction of binaries with q > 0.5 in the core as a function of the absolute visual magnitude of the host GC. Dashed line is the best fitting straight line whose slope (s) and intercept (i) are quoted in the figure together with the Pearson correlation coefficient (r). PCC clusters are marked with red crosses and are not used to calculate neither the best-fitting line nor r. For completeness in the upper-right panels we show the same plot for the fraction of binaries with q > 0.6, and q > 0.7. Lower panels: fraction of binaries with q > 0.5 in the rC − HM (left) and roHM (right) sample as a function of MV.
Current usage metrics show cumulative count of Article Views (full-text article views including HTML views, PDF and ePub downloads, according to the available data) and Abstracts Views on Vision4Press platform.
Data correspond to usage on the plateform after 2015. The current usage metrics is available 48-96 hours after online publication and is updated daily on week days.
Initial download of the metrics may take a while.