Fig. A.4
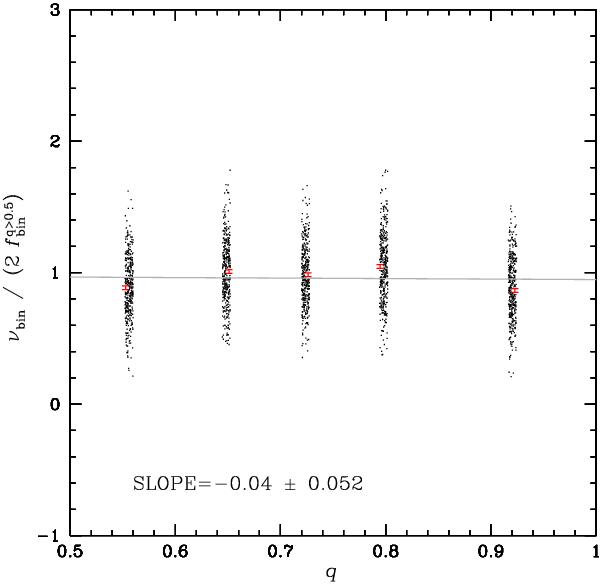
Fractions of binaries per unit q measured in five mass-ratio intervals as a function of q for all the simulated GCs. To compare the q distribution in simulated clusters with different fraction of binaries, we divided νbin by two times the fraction of binaries with q > 0.5. For clarity, black points have been randomly scattered around the corresponding q value. The means normalized binary fractions in each mass-ratio bin are represented by red points with error bars, while the gray line is the best fitting line, whose slope is quoted in the inset.
Current usage metrics show cumulative count of Article Views (full-text article views including HTML views, PDF and ePub downloads, according to the available data) and Abstracts Views on Vision4Press platform.
Data correspond to usage on the plateform after 2015. The current usage metrics is available 48-96 hours after online publication and is updated daily on week days.
Initial download of the metrics may take a while.