Fig. A.3
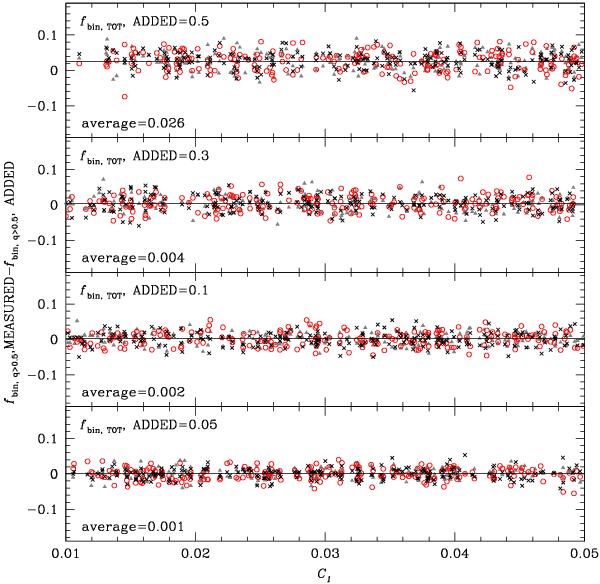
Difference between the measured fraction of binaries and the fraction of binaries in input as a function of the parameter C1 for four difference values of the input binary fraction. Black lines indicate the average difference. Red circles, gray triangles and black crosses indicate simulations with C2 = 3, 5, and 8 respectively.
Current usage metrics show cumulative count of Article Views (full-text article views including HTML views, PDF and ePub downloads, according to the available data) and Abstracts Views on Vision4Press platform.
Data correspond to usage on the plateform after 2015. The current usage metrics is available 48-96 hours after online publication and is updated daily on week days.
Initial download of the metrics may take a while.