Fig. 32
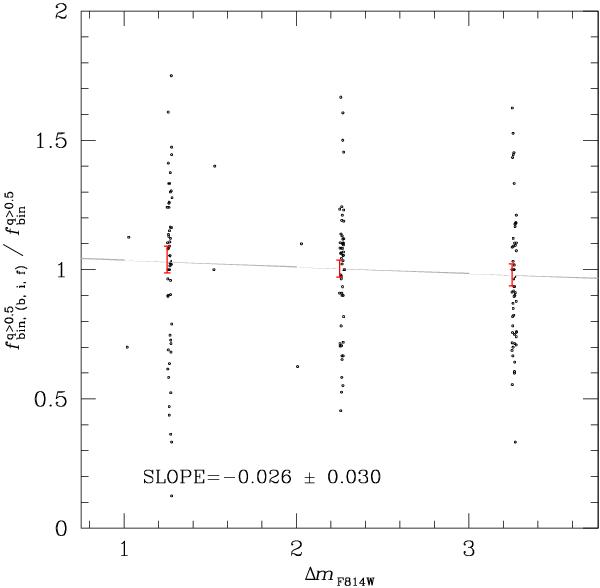
Fraction of binaries with q > 0.5 measured in three magnitude intervals (black points) as a function of ΔmF814W for the 59 GCs studied in this work. To compare the fraction of binaries in different clusters we have divided the fraction of binaries in each bin by the value of  measured in the interval between 0.75 and 3.75 F814W magnitudes below the MS turn off. For clarity black points have been randomly scattered around the corresponding ΔmF814W value. Red points with error bars are the average binary fractions in each interval while the gray line is the best fitting least-square line whose slope is quoted in the inset.
Current usage metrics show cumulative count of Article Views (full-text article views including HTML views, PDF and ePub downloads, according to the available data) and Abstracts Views on Vision4Press platform.
Data correspond to usage on the plateform after 2015. The current usage metrics is available 48-96 hours after online publication and is updated daily on week days.
Initial download of the metrics may take a while.