Free Access
Fig. 28
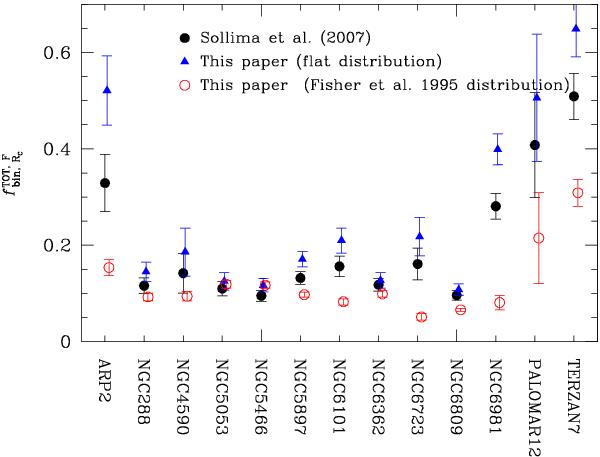
Comparison of the core binary fractions of 13 GCs measured in this paper (red circles) and in Sollima et al. (2007, black circles). In both cases has been assumed the mass-ratio distribution from Fisher et al. (2005). Blue triangles indicate the binary fraction estimated in this work assuming a flat q distribution.
Current usage metrics show cumulative count of Article Views (full-text article views including HTML views, PDF and ePub downloads, according to the available data) and Abstracts Views on Vision4Press platform.
Data correspond to usage on the plateform after 2015. The current usage metrics is available 48-96 hours after online publication and is updated daily on week days.
Initial download of the metrics may take a while.