Fig. 27
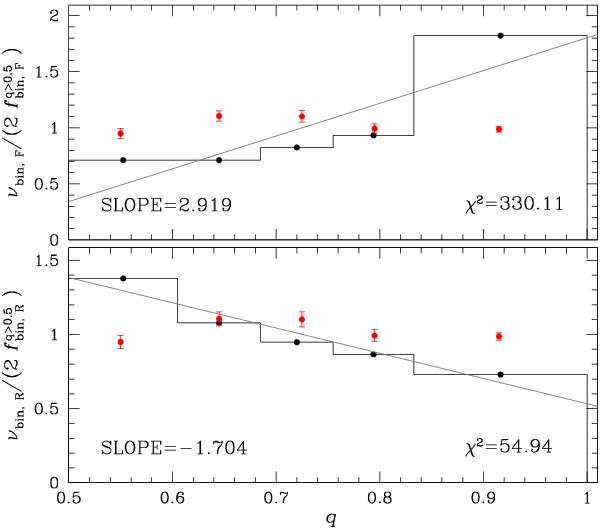
Frequency of binaries divided by two times the fraction of binaries with q > 0.5 expected for the cases of Fisher et al. (2005) mass-ratio distribution (upper panel) and from the distribution obtained by randomly extracting secondary stars from a Kroupa (2002) IMF (bottom panels). Red points with the error bars are the mean values of the observed binary frequency normalized by two times  and have been already plotted in Fig. 25. The slope of the best-fitting least-squares gray straight lines and the reduced-χ2 obtained from the comparison of the observed and theoretical distribution are quoted in the figure.
Current usage metrics show cumulative count of Article Views (full-text article views including HTML views, PDF and ePub downloads, according to the available data) and Abstracts Views on Vision4Press platform.
Data correspond to usage on the plateform after 2015. The current usage metrics is available 48-96 hours after online publication and is updated daily on week days.
Initial download of the metrics may take a while.