Fig. 23
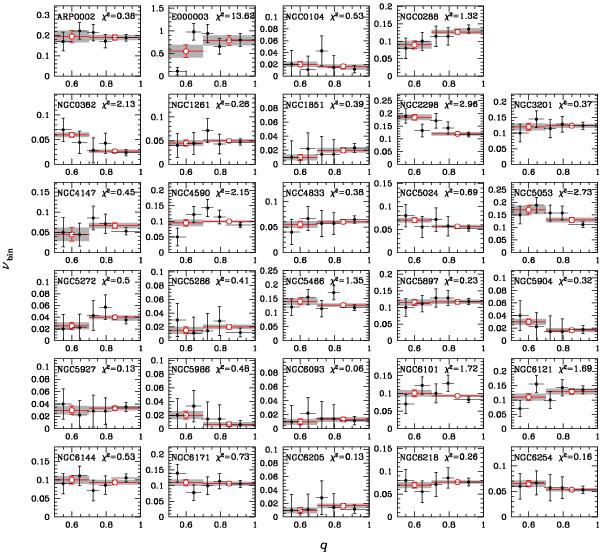
Mass-ratio distribution for the binary population in the ACS field of 29 GCs. Black filled-circles show the normalized fraction of binaries in five mass-ratio intervals, while red open-circles indicate the νbin,i values obtained by using only two bins with 0.5 < q < 0.7, and 0.7 < q < 1. Horizontal segments mark the adopted mass-ratio interval, while observational errors are plotted as the vertical lines and shadowed areas.
Current usage metrics show cumulative count of Article Views (full-text article views including HTML views, PDF and ePub downloads, according to the available data) and Abstracts Views on Vision4Press platform.
Data correspond to usage on the plateform after 2015. The current usage metrics is available 48-96 hours after online publication and is updated daily on week days.
Initial download of the metrics may take a while.