Fig. 4
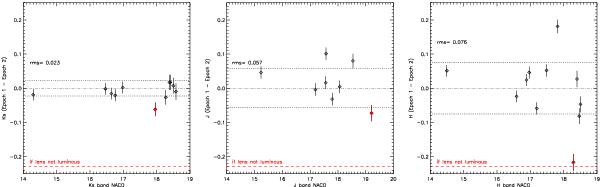
Relative photometry of the NACO epochs for each band calibrated/aligned to epoch 1 based on stars within 4″ of MOA-2007-BLG-192.The black points are constant stars, so their scatter gives an estimate of the error. The red dashed line marks the expected magnitude difference of the target assuming no light from the lens is detected. The red diamonds show the flux changes of the target, which are inconsistent with such a scenario at a 3 − σ level for J and even with higher significance for our best data set in K band. The poor quality of the epoch 2 H band data as evident by the large scatter does not provide any useful constraint. Table 2 gives the derived values for all bands and different choices of the field of comparison stars.
Current usage metrics show cumulative count of Article Views (full-text article views including HTML views, PDF and ePub downloads, according to the available data) and Abstracts Views on Vision4Press platform.
Data correspond to usage on the plateform after 2015. The current usage metrics is available 48-96 hours after online publication and is updated daily on week days.
Initial download of the metrics may take a while.