| Issue |
A&A
Volume 539, March 2012
|
|
|---|---|---|
| Article Number | L2 | |
| Number of page(s) | 4 | |
| Section | Letters | |
| DOI | https://doi.org/10.1051/0004-6361/201118668 | |
| Published online | 22 February 2012 | |
Detection of very-high energy γ-ray emission from NGC 1275 by the MAGIC telescopes
1 IFAE, Edifici Cn., Campus UAB, 08193 Bellaterra, Spain
2 Universidad Complutense, 28040 Madrid, Spain
3 INAF National Institute for Astrophysics, 00136 Rome, Italy
4 Università di Siena, and INFN Pisa, 53100 Siena, Italy
5 Technische Universität Dortmund, 44221 Dortmund, Germany
6 Max-Planck-Institut für Physik, 80805 München, Germany
e-mail: This email address is being protected from spambots. You need JavaScript enabled to view it.
7 Università di Padova and INFN, 35131 Padova, Italy
e-mail: This email address is being protected from spambots. You need JavaScript enabled to view it.
8 Inst. de Astrofísica de Canarias, 38200 La Laguna, Tenerife, Spain
9 Depto. de Astrofísica, Universidad de La Laguna, 38206 La Laguna, Spain
10 University of Łódź, 90236 Lodz, Poland
11 Deutsches Elektronen-Synchrotron (DESY), 15738 Zeuthen, Germany
12 ETH Zurich, 8093 Zurich, Switzerland
e-mail: This email address is being protected from spambots. You need JavaScript enabled to view it.
13 Universität Würzburg, 97074 Würzburg, Germany
14 Universitat de Barcelona (ICC/IEEC), 08028 Barcelona, Spain
15 Università di Udine, and INFN Trieste, 33100 Udine, Italy
16 Institut de Ciències de l’Espai (IEEC-CSIC), 08193 Bellaterra, Spain
17 Inst. de Astrofísica de Andalucía (CSIC), 18080 Granada, Spain
18 Croatian MAGIC Consortium, Rudjer Boskovic Institute, University of Rijeka and University of Split, 10000 Zagreb, Croatia
e-mail: This email address is being protected from spambots. You need JavaScript enabled to view it.
19 Universitat Autònoma de Barcelona, 08193 Bellaterra, Spain
20 Tuorla Observatory, University of Turku, 21500 Piikkiö, Finland
21 Inst. for Nucl. Research and Nucl. Energy, 1784 Sofia, Bulgaria
22 INAF/Osservatorio Astronomico and INFN, 34143 Trieste, Italy
23 Università dell’Insubria, Como, 22100 Como, Italy
24 Università di Pisa, and INFN Pisa, 56126 Pisa, Italy
25 ICREA, 08010 Barcelona, Spain
26 now at Ecole polytechnique fédérale de Lausanne (EPFL), Lausanne, Switzerland
27 supported by INFN Padova
28 now at: Centro de Investigaciones Energéticas, Medioambientales y Tecnológicas (CIEMAT), Madrid, Spain
29 now at: Finnish Centre for Astronomy with ESO (FINCA), University of Turku, Finland
30 HITS, Schloss-Wolfsbrunnenweg 33, 69118 Heidelberg, Germany
31 UC Santa Barbara, CA 93106, Santa Barbara, USA
Received: 16 December 2011
Accepted: 23 January 2012
Abstract
We report on the detection of very-high energy (VHE, E > 100 GeV) γ-ray emission from NGC 1275, the central radio galaxy of the Perseus cluster of galaxies. The source has been detected by the MAGIC telescopes with a statistical significance of 6.6σ above 100 GeV in 46 h of stereo observations carried out between August 2010 and February 2011. The measured differential energy spectrum between 70 GeV and 500 GeV can be described by a power law with a steep spectral index of Γ = −4.1 ± 0.7stat ± 0.3syst, and the average flux above 100 GeV is Fγ = (1.3 ± 0.2stat ± 0.3syst) × 10-11 cm-2 s-1. These results, combined with the power-law spectrum measured in the first two years of observations by the Fermi-LAT above 100 MeV, with a spectral index of Γ ≃ − 2.1, strongly suggest the presence of a break or cut-off around tens of GeV in the NGC 1275 spectrum. The light curve of the source above 100 GeV does not show hints of variability on a month time scale. Finally, we report on the nondetection in the present data of the radio galaxy IC 310, previously discovered by the Fermi-LAT and MAGIC. The derived flux upper limit FU.L.γ (>300 GeV) = 1.2 × 10⁻¹² cm-2 s-1 is a factor ~ 3 lower than the mean flux measured by MAGIC between October 2009 and February 2010, thus confirming the year time-scale variability of the source at VHE.
Key words: galaxies: active / galaxies: jets / galaxies: individual: NGC 1275 / gamma rays: galaxies / galaxies: individual: IC310
Corresponding authors: S. Lombardi (This email address is being protected from spambots. You need JavaScript enabled to view it. ), P. Colin (This email address is being protected from spambots. You need JavaScript enabled to view it. ), D. Hildebrand (This email address is being protected from spambots. You need JavaScript enabled to view it. ), and F. Zandanel (This email address is being protected from spambots. You need JavaScript enabled to view it. )
© ESO, 2012
1. Introduction
NGC 1275 (z = 0.0179), the central dominant galaxy of the Perseus cluster, harbors one of the closest active galactic nuclei (AGN), already included in the original Seyfert list (Seyfert 1943). The AGN is a very bright radio source showing an extended jet with Fanaroff-Riley I morphology (e.g. Vermeulen et al. 1994; Buttiglione et al. 2010). The optical emission of the nucleus is variable and strongly polarized from 3% to 6% (Maza 1979; Martin et al. 1983), implying that the relativistic jet contributes significantly to the optical continuum (Angel & Stockman 1980). The source has also been classified as a BL Lac object (Veron 1978). However, the jet increases its inclination from 10° to 20° on milliarcsecond scales up to 40° to 60° at arcsecond scales (Krichbaum et al. 1992). Due to its brightness and proximity this source is ideally suited to study the physics of relativistic outflows and the “feedback” effects of the jet on the cluster environment (e.g. Fabian et al. 2008; Gallagher 2009).
In fact, NGC 1275 is one of the closest γ-ray emitting AGN. It was first unambiguously detected in the high-energy (HE, 100 MeV < E < 100 GeV) γ-ray range by the Fermi Large Area Telescope (LAT) (Abdo et al. 2009), during the first four months of all-sky-survey observations, with an average flux above 100 MeV of Fγ = (2.10 ± 0.23) × 10-7 cm-2 s-1. The differential energy spectrum between 100 MeV and 25 GeV was described well by a power law with a spectral index of Γ = −2.17 ± 0.05. While no variability was observed during these four months of observations, subsequent results based on the first year of Fermi-LAT observations (Kataoka et al. 2010) show evidence of flux variability on time scales of months. Furthermore, the average γ-ray spectrum show a significant deviation from a simple power law, indicating an exponential cut-off at the break photon energy of Ec = (42.2 ± 19.6) GeV.
More recently, the results obtained from the first two years of Fermi-LAT observations (Brown & Adams 2011) have given clear evidence for variability on time scales of days above 800 MeV, revealing that several major flaring events occurred during the two-year observation period. A harder-when-brighter correlation between flux and spectral index was also found. Brighter and therefore harder > GeV states are then promising for triggering observations at very high energy (VHE, E > 100 GeV). Finally, present upper limits at VHE provided by MAGIC-I (Aleksić et al. 2010a) and VERITAS (Acciari et al. 2009) combined with the Fermi-LAT results mentioned above suggested that NGC 1275 may have a break or cut-off in the spectrum around tens of GeV.
The Perseus galaxy cluster contains another γ-ray source, the radio galaxy IC 310, located at ~0.6° from NGC 1275. It was discovered in 2010 by the Fermi-LAT in the 30 GeV–300 GeV energy range (Neronov et al. 2010) and for energies > 260 GeV by MAGIC (Aleksić et al. 2010b). The combined MAGIC and Fermi-LAT spectrum is consistent with a flat spectral energy distribution (SED) stretching without a break over more than three orders of magnitude in energy (2 GeV–7 TeV). The spectrum at VHE measured by MAGIC has a spectral index of Γ = −2.00 ± 0.14, and the mean flux above 300 GeV, from October 2009 to February 2010, was Fγ = (3.1 ± 0.5) × 10-12 cm-2 s-1. Strong hints of a week to a year time-scale variability were seen in the MAGIC data.
In this letter we present the results of the observations of NGC 1275 at VHE performed with the MAGIC telescopes between August 2010 and February 2011, which resulted in the first detection of the source above 100 GeV. The same observational campaign also provided results on the variability at VHE of IC 310. This letter is accompanied by a separate paper dedicated to the study of the Perseus cluster environment, focusing on possible VHE γ-ray emission induced by cosmic rays (Aleksić et al. 2011). The multiwavelength emission of NGC 1275 from radio to VHE will be addressed in future work.
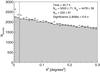 |
Fig. 1 θ2 distributions of the NGC 1275 signal and the background estimation from 45.7 h of MAGIC stereo observations taken between August 2010 and February 2011, above an energy threshold of 100 GeV. The region between zero and the vertical dashed line (at 0.02 degrees2) represents the signal region. |
2. Observations and analysis
The MAGIC system consists of two 17 m dish Imaging Air Cherenkov Telescopes (IACTs) located at the Roque de los Muchachos observatory, in the Canary Island of La Palma (28.8°N, 17.8°W, 2200 m a.s.l.). Since late 2009 the telescopes are working in stereoscopic mode providing an excellent sensitivity of <0.8% of the Crab flux (C.U.)1 for energies above ~300 GeV in 50 h of observations (Aleksić et al. 2012) and a trigger energy threshold of 50 GeV, which is the lowest among the existing IACTs. The MAGIC telescopes are currently the most sensitive instrument between 50 GeV and 200 GeV, allowing us to extend up to the TeV scale the observations carried out by the Fermi-LAT.
The Perseus galaxy cluster region was observed by the MAGIC telescopes during two campaigns. The first one was carried out between October 2009 and February 2010, for a total observation time of 45.3 h. This survey resulted in the discovery of the radio galaxy IC 310 as VHE emitter (Aleksić et al. 2010b). The latest campaign (total observation time of 53.6 h), which resulted in the detection of NGC 1275 at VHE presented in this letter, was performed between August 2010 and February 2011. The source was observed in the wobble mode (Fomin et al. 1994), with data equally split in four pointing positions located symmetrically at 0.4° from NGC 1275, in order to ensure optimum sky coverage and background estimation. The survey was carried out during dark time at low zenith angles (from 12° to 36°), which guaranteed the lowest energy threshold (~50 GeV).
The data analysis was performed using the standard MAGIC software package (Albert et al. 2008b; Aliu et al. 2009), taking advantage of newly developed stereoscopic analysis routines (Moralejo et al. 2009; Aleksić et al. 2012; Lombardi et al. 2011). The analysis cuts applied to NGC 1275 data were optimized by means of contemporaneous Crab nebula data and Monte Carlo (MC) simulations.
After the application of standard quality checks, 7.9 h of data were rejected mainly due to nonoptimal atmospheric conditions. The selected sample used for deriving the results presented here is therefore composed by 45.7 h of good quality stereo data.
3. Results
The θ2 distributions2 with respect the signal region and the background (estimated from 3 distinct regions), for energies above 100 GeV, are shown in Fig. 1. We found an excess of 522 ± 81 events, corresponding to a significance of 6.6 standard deviations (σ), calculated according to the Eq. (17) of Li & Ma (1983). It is worth noting that the background estimation is not affected by a possible IC 310γ-ray contribution, since the latter source was not detected in the present data.
The NGC 1275 differential energy spectrum measured by MAGIC between 70 GeV and 500 GeV can be described by a simple power law (χ2/nd.o.f. = 0.76/1) 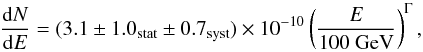 (1)in units of cm-2 s-1 TeV-1, with Γ = −4.1 ± 0.7stat ± 0.3syst3. The mean flux above 100 GeV is Fγ = (1.3 ± 0.2stat ± 0.3syst) × 10-11 cm-2 s-1, corresponding to (2.5 ± 0.4stat ± 0.6syst)% C.U. The steepness of the spectral index measured by MAGIC strongly supports the presence of a break or cut-off in the NGC 1275 spectrum around tens of GeV, as already suggested by the Fermi-LAT results (Kataoka et al. 2010; Brown & Adams 2011), and is consistent with the upper limits on the flux at VHE provided by MAGIC-I (Aleksić et al. 2010a) and VERITAS (Acciari et al. 2009). The rapid decline in the spectrum, which causes the NGC 1275 signal to vanish above approximately 500 GeV, permits investigating possible VHE γ-ray emissions induced by cosmic rays in the Perseus cluster environment above that energy (Aleksić et al. 2011).
In Fig. 2, the SED measured by MAGIC is compared with the results in the 100 MeV–100 GeV range provided by the Fermi-LAT, averaging Fermi data over the first year (Kataoka et al. 2010) and the first two years (Brown & Adams 2011). The comparison suggests that a significant spectral steepening occurs around ~100 GeV. However, the present non-simultaneous data do not allow discussing whether the spectral change corresponds to a break between two power laws or exponential cut-off.
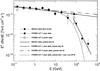 |
Fig. 2 NGC 1275 spectral energy distribution measured by MAGIC between 70 GeV and 500 GeV (filled squares), together with the results above 100 MeV achieved from the first year (filled circles, Kataoka et al. 2010), and from the first two years (open circles, Brown & Adams 2011) of the Fermi-LAT all-sky-survey observations. The power-law fits to the Fermi-LAT data (extrapolated up to 1 TeV) are also shown, together with the exponential power-law fit provided in Kataoka et al. (2010). |
The August 2010 to February 2011 light curve of NGC 1275 computed for an energy threshold of 100 GeV and with a monthly binning is shown in Fig. 3. No evidence of variability can be derived from these measurements. In fact, fitting the light curve with a constant flux hypothesis yields a χ2/nd.o.f. = 7.4/6, corresponding to a probability P(χ2) = 0.29.
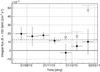 |
Fig. 3 NGC 1275 light curve between August 2010 and February 2011 above an energy threshold of 100 GeV, and with a month time-scale binning. No hints of variability are seen in the data. The dashed horizontal line represents the constant function resulting from the fit to the data. For the December 2010, January 2011, and February 2011 data, the upper limits on the flux above 100 GeV for a spectral index of Γ = −4.0 (calculated using the Rolke et al. 2005 method with a confidence level of 95%, and a total systematic uncertainty of 30%) are also shown (open dashed arrows). |
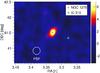 |
Fig. 4 Significance skymap of the central region of the Perseus galaxy cluster from 45.7 h of MAGIC stereo observations taken between August 2010 and February 2011, above an energy threshold of 100 GeV. The NGC 1275 position is marked with a black cross, whereas the position of the radio galaxy IC 310 is shown by a green star. The PSF of about 0.12° is also displayed. The hot spot in the map at a significance level > 6σ is consistent with a point-like emission coming from the NGC 1275 sky position. |
The significance skymap of the central region of the Perseus cluster above 100 GeV is shown in Fig. 4. A hot spot at >6σ significance level consistent with the sky position of NGC 1275 is present. The position of the radio galaxy IC 310 is also shown. No significant excess events coming from IC 310 have been found in the observations presented here. The corresponding integral flux upper limit above 300 GeV (performed using the Rolke et al. 2005 method, with a confidence level of 95%, and a total systematic uncertainty of 30%) is  , for a spectral index of Γ = −2.0 (i.e. the spectral index of the source previously measured by MAGIC). This value is about a factor 3 lower than the average integral flux Fγ(>300 GeV) = (3.1 ± 0.5) × 10-12 cm-2 s-1 measured by MAGIC from October 2009 to February 2010 (Aleksić et al. 2010b), thereby confirming the variability of the latter source on a year’s time scale.
4. Conclusions
The MAGIC telescopes have detected VHE γ-ray emission from NGC 1275, the central radio galaxy in the Perseus cluster, at a statistical significance of 6.6σ from observations performed between August 2010 and February 2011. The corresponding average flux above 100 GeV is Fγ = (1.3 ± 0.2stat ± 0.3syst) × 10-11 cm-2 s-1. This is the fourth nearby radio galaxy detected at VHE, after M 87 (Aharonian et al. 2003, 2006; Albert et al. 2008a; Acciari et al. 2008), Cen A (Aharonian et al. 2009), and IC 310 (Aleksić et al. 2010b). The MAGIC observation yields a spectrum that can be fitted between 70 GeV and 500 GeV by a simple power law with a spectral index of Γ = −4.1 ± 0.7stat ± 0.3syst. This result, combined with previous Fermi-LAT results (Abdo et al. 2009; Kataoka et al. 2010; Brown & Adams 2011), showing a power-law spectrum with a spectral index of Γ ≃ − 2.1 above 100 MeV, strongly suggests the presence of a break or cut-off around tens of GeV in the NGC 1275 spectrum. No evidence of variability on month time scale has been found above 100 GeV. Finally, the variability on a year time scale of the source IC 310 (Neronov et al. 2010; Aleksić et al. 2010b) has been confirmed. The upper limit above 300 GeV presented here is in fact about a factor 3 lower than the flux measured by MAGIC between October 2009 and February 2010.
In this letter C.U. stands for Crab units, defined as the fraction of the Crab nebula flux given in Eq. (1) of Aleksić et al. (2012), which corresponds for energies above 100 GeV to 5.4 × 10⁻¹⁰ cm-2 s-1.
The θ2 is the squared angular distance between the arrival direction of the events and a given nominal position (e.g. Daum et al. 1997).
The systematic errors of the flux normalization and the energy spectral slope considered here have been estimated to be 23% and ± 0.3, respectively, whereas the systematic error on the energy scale is 17%. These values are more conservative than those presented in Aleksić et al. (2012), given the flux weakness and the spectral steepness of NGC 1275, as measured by MAGIC.
Acknowledgments
We would like to thank the Instituto de Astrofísica de Canarias for the excellent working conditions at the Observatorio del Roque de los Muchachos in La Palma. The support of the German BMBF and MPG, the Italian INFN, the Swiss National Fund SNF, and the Spanish MICINN is gratefully acknowledged. This work was also supported by the Marie Curie program, by the CPAN CSD2007-00042 and MultiDark CSD2009-00064 projects of the Spanish Consolider-Ingenio 2010 program, by grant DO02-353 of the Bulgarian NSF, by grant 127740 of the Academy of Finland, by the YIP of the Helmholtz Gemeinschaft, by the DFG Cluster of Excellence “Origin and Structure of the Universe”, by the DFG Collaborative Research Centers SFB823/C4 and SFB876/C3, and by the Polish MNiSzW grant 745/N-HESS-MAGIC/2010/0. C.P. gratefully acknowledges financial support of the Klaus Tschira Foundation.
References
- Abdo, A. A., Ackermann, M., Ajello, M., et al. 2009, ApJ, 699, L31 [NASA ADS] [CrossRef] [Google Scholar]
- Acciari, V. A., Beilicke, M., Blaylock, G., et al. 2008, ApJ, 679, L397 [NASA ADS] [CrossRef] [Google Scholar]
- Acciari, V. A., Aliu, E., Arlen, T., et al. 2009, ApJ, 706, L275 [Google Scholar]
- Aharonian, F. A., Akhperjanian, A. G., Beilicke, M., et al. 2003, A&A, 403, L1 [NASA ADS] [CrossRef] [EDP Sciences] [Google Scholar]
- Aharonian, F. A., Akhperjanian, A. G., Bazer-Bachi, A. R., et al. 2006, Science, 314, 1424 [NASA ADS] [CrossRef] [PubMed] [Google Scholar]
- Aharonian, F. A., Akhperjanian, A. G., Anton, G., et al. 2009, ApJ, 695, L40 [NASA ADS] [CrossRef] [Google Scholar]
- Albert, J., Aliu, E., Anderhub, H., et al. 2008a, ApJ, 685, L23 [NASA ADS] [CrossRef] [Google Scholar]
- Albert, J., Aliu, E., Anderhub, H., et al. 2008b, ApJ, 674, L1037 [NASA ADS] [CrossRef] [Google Scholar]
- Aleksić, J., Antonelli, L. A., Antoranz, P., et al. 2010a, ApJ, 710, L634 [NASA ADS] [CrossRef] [Google Scholar]
- Aleksić, J., Antonelli, L. A., Antoranz, P., et al. 2010b, ApJ, 723, L207 [NASA ADS] [CrossRef] [Google Scholar]
- Aleksić, J., Alvarez, E. A., Antonelli, L. A., et al. 2011, A&A, submitted [arXiv:1111.5544] [Google Scholar]
- Aleksić, J., Alvarez, E. A., Antonelli, L. A., et al. 2012, Astropart. Phys., 35, 435 [NASA ADS] [CrossRef] [Google Scholar]
- Aliu, E., Anderhub, H., Antonelli, L. A., et al. 2009, Astropart. Phys., 30, 293 [NASA ADS] [CrossRef] [Google Scholar]
- Angel, J. R. P., & Stockman, H. S. 1980, ARA&A, 18, 321 [NASA ADS] [CrossRef] [Google Scholar]
- Brown, A. M., & Adams, J. 2011, MNRAS, 413, 2785 [NASA ADS] [CrossRef] [Google Scholar]
- Buttiglione, S., Capetti, A., Celotti, A., et al. 2010, A&A, 509, A6 [NASA ADS] [CrossRef] [EDP Sciences] [Google Scholar]
- Daum, A., Hermann, G., Hess, M., et al. 1997, Astropart. Phys., 8, 1 [NASA ADS] [CrossRef] [Google Scholar]
- Fabian, A. C., Johnstone, R. M., Sanders, J. S., et al. 2008, Nature, 454, 968 [NASA ADS] [CrossRef] [PubMed] [Google Scholar]
- Fomin, V. P., Stepanian, A. A., Lamb, R. C., et al. 1994, Astropart. Phys., 2, 137 [NASA ADS] [CrossRef] [Google Scholar]
- Gallagher, J. S., 2009, AN, 330, 1040G [NASA ADS] [Google Scholar]
- Kataoka, J., Stawarz, Ł., Cheung, C. C., et al. 2010, ApJ, 715, L554 [NASA ADS] [CrossRef] [Google Scholar]
- Krichbaum, T. P., Witzel, A., Graham, D. A., et al. 1992, A&A, 260, L33 [NASA ADS] [Google Scholar]
- Li, T.-P., & Ma, Y.-Q. 1983, ApJ, 272, L317 [NASA ADS] [CrossRef] [Google Scholar]
- Lombardi, S., Berger, K., Colin, P., et al. 2011, Proc. of 32nd ICRC, Beijin, China [arXiv:1109.6195] [Google Scholar]
- Martin, P. G., Thompson, I. B., Maza, J., & Angel, J. R. P. 1983, ApJ, 266, L470 [CrossRef] [Google Scholar]
- Maza, J. 1979, Ph.D. Thesis, Univ. Toronto [Google Scholar]
- Moralejo, A., Gaug, M., Carmona, E., et al. 2009, Proc. of 31st ICRC, Łódź, Poland [arXiv:0907.0943] [Google Scholar]
- Neronov, A., Semikoz, D. V., & Vovk, I. 2010, A&A, 519, L6 [Google Scholar]
- Rolke, W. A., López, A. M., & Conrad, J. 2005, Nucl. Instrum. Methods Phys. Res. A, 551, 493 [NASA ADS] [CrossRef] [Google Scholar]
- Seyfert, C. K. 1943, ApJ, 97, 28 [NASA ADS] [CrossRef] [Google Scholar]
- Vermeulen, R. C., Readhead, A. C. S., & Backer, D. C. 1994, ApJ, 430, L41 [NASA ADS] [CrossRef] [Google Scholar]
- Veron, P. 1978, Nature, 272, 430 [NASA ADS] [CrossRef] [Google Scholar]
All Figures
|
Fig. 1 θ2 distributions of the NGC 1275 signal and the background estimation from 45.7 h of MAGIC stereo observations taken between August 2010 and February 2011, above an energy threshold of 100 GeV. The region between zero and the vertical dashed line (at 0.02 degrees2) represents the signal region. |
| In the text | |
|
Fig. 2 NGC 1275 spectral energy distribution measured by MAGIC between 70 GeV and 500 GeV (filled squares), together with the results above 100 MeV achieved from the first year (filled circles, Kataoka et al. 2010), and from the first two years (open circles, Brown & Adams 2011) of the Fermi-LAT all-sky-survey observations. The power-law fits to the Fermi-LAT data (extrapolated up to 1 TeV) are also shown, together with the exponential power-law fit provided in Kataoka et al. (2010). |
| In the text | |
|
Fig. 3 NGC 1275 light curve between August 2010 and February 2011 above an energy threshold of 100 GeV, and with a month time-scale binning. No hints of variability are seen in the data. The dashed horizontal line represents the constant function resulting from the fit to the data. For the December 2010, January 2011, and February 2011 data, the upper limits on the flux above 100 GeV for a spectral index of Γ = −4.0 (calculated using the Rolke et al. 2005 method with a confidence level of 95%, and a total systematic uncertainty of 30%) are also shown (open dashed arrows). |
| In the text | |
|
Fig. 4 Significance skymap of the central region of the Perseus galaxy cluster from 45.7 h of MAGIC stereo observations taken between August 2010 and February 2011, above an energy threshold of 100 GeV. The NGC 1275 position is marked with a black cross, whereas the position of the radio galaxy IC 310 is shown by a green star. The PSF of about 0.12° is also displayed. The hot spot in the map at a significance level > 6σ is consistent with a point-like emission coming from the NGC 1275 sky position. |
| In the text | |
Current usage metrics show cumulative count of Article Views (full-text article views including HTML views, PDF and ePub downloads, according to the available data) and Abstracts Views on Vision4Press platform.
Data correspond to usage on the plateform after 2015. The current usage metrics is available 48-96 hours after online publication and is updated daily on week days.
Initial download of the metrics may take a while.