Fig. 3
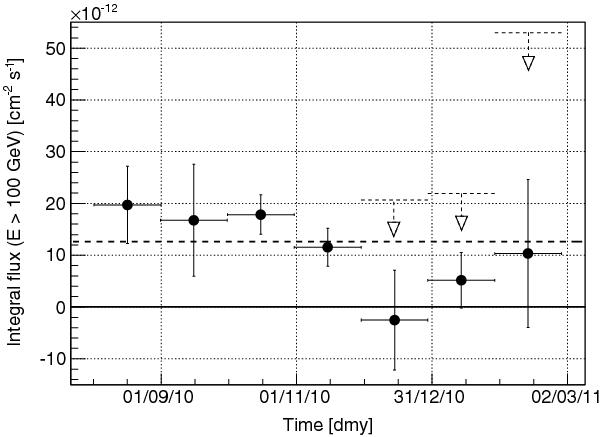
NGC 1275 light curve between August 2010 and February 2011 above an energy threshold of 100 GeV, and with a month time-scale binning. No hints of variability are seen in the data. The dashed horizontal line represents the constant function resulting from the fit to the data. For the December 2010, January 2011, and February 2011 data, the upper limits on the flux above 100 GeV for a spectral index of Γ = −4.0 (calculated using the Rolke et al. 2005 method with a confidence level of 95%, and a total systematic uncertainty of 30%) are also shown (open dashed arrows).
Current usage metrics show cumulative count of Article Views (full-text article views including HTML views, PDF and ePub downloads, according to the available data) and Abstracts Views on Vision4Press platform.
Data correspond to usage on the plateform after 2015. The current usage metrics is available 48-96 hours after online publication and is updated daily on week days.
Initial download of the metrics may take a while.