| Issue |
A&A
Volume 539, March 2012
|
|
|---|---|---|
| Article Number | A152 | |
| Number of page(s) | 6 | |
| Section | Planets and planetary systems | |
| DOI | https://doi.org/10.1051/0004-6361/201118505 | |
| Published online | 09 March 2012 | |
The extra red plutino (55638) 2002 VE95⋆
1 LESIA-Observatoire de Paris, CNRS, UPMC Univ Paris 06, Univ. Paris-Diderot, 5 Place J. Janssen, 92195 Meudon Principal Cedex, France
e-mail: This email address is being protected from spambots. You need JavaScript enabled to view it.
2 Université Paris 7 Denis Diderot, Sorbonne Paris Cité, Paris, France
3 Istituto Nazionale di Astrofisica (INAF), Osservatorio Astronomico di Capodimonte, Italy
4 ESO, Santiago, Chile
5 Max-Planck-Institute for Extraterrestrial Physics, Germany
6 Deutsches Zentrum für Luft-und Raumfahrt, Germany
7 Konkoly Observatory of the Hungarian Academy of Sciences, Hungary
8 Istituto Nazionale di Astrofisica (INAF), Osservatorio Astronomico di Roma, Italy
Received: 23 November 2011
Accepted: 2 February 2012
Abstract
Aims. In the framework of a large program, we observed (55638) 2002 VE95 with the ESO-VLT telescope to better constrain its surface composition and to investigate the possible heterogeneity of the surface.
Methods. We report new near-infrared observations performed in 2007 and 2008. Using the new constraints of the albedo obtained by Herschel Space Observatory observations, a surface model was computed using the complete set of spectra (from visible to the near-infrared) as well as those of the previous published data to investigate the surface composition properties of (55638) 2002 VE95.
Results. The surface is heterogeneous. This red object is covered by different icy compounds, such as water (4–19%) and methanol (10–12%). Different organic compounds, such as titan and triton tholins seem also to be present in the surface. The amount of the components is different depending on the observed area. That methanol ice seems to be present mainly on very red surface favors the hypothesis that surfaces of very red objects are more primordial.
Key words: techniques: spectroscopic / Kuiper belt objects: individual: (55638) 2002 VE95
Based on observations made with ESO Very Large Telescope at the La Silla-Paranal Observatory under program ID 178.C-0036 (PI: A. Barucci) and the Herschel Space Observatory. Herschel is an ESA space observatory with science instruments provided by European-led Principal Investigator consortia and with important participation from NASA.
© ESO, 2012
1. Introduction
The transneptunian object (55638) 2002 VE95 has been observed in the framework of a large program carried out at ESO-VLT using almost simultaneously the UT1, UT2, and UT4 telescopes (Cerro Paranal, Chile) in 2007 and 2008 (Barucci et al. 2010a). The aim of this large program was to obtain high signal-to-noise ratio (S/N) simultaneous visible and near-IR spectroscopy (using FORS, ISAAC and SINFONI instruments) for almost all transneptunian objects observable within the VLT capability. A total of 40 objects have been observed in the framework of this program (Barucci et al. 2011).
(55638) 2002 VE95 is a peculiar object of the dynamical Plutino class (orbit in the 3:2 resonance with Neptune). It is among the reddest objects and belongs to the RR taxonomic group of the trans-Neptunian object (TNO) and Centaur population (Fulchignoni et al. 2008). Barucci et al. (2006) already observed it spectroscopically and detected water ice and clear evidence of methanol in its surface. Fornasier et al. (2009) reported new visible spectral observations with a steep visible slope of 40 ± 0.1%/(103 Å), very similar to the extra red object (90377) Sedna, and different from the previous visible observations reported by Barucci et al. (2006), for which the computed slope was 27.9 ± 0.1%/(103 Å). The period is not well known, Ortiz et al. (2006) reported a noisy lightcurve with a small amplitude of about 0.08 with possible periodicities of 6.76 or 9.47 hrs. Thirouin et al. (2010) reported new observations with a rotational period of 9.97 h and an amplitude of 0.05 ± 0.01 mag. Even though these authors detected the periodicity with more than 99% confidence level, they concluded because of the smaller amplitude that their derivation is only tentative and more observation data with smaller scatter will be necessary to derive a completely reliable rotational period. New photometric color data obtained by Perna et al. (2010) confirmed the RR taxonomic group.
This object has been also observed by the Herschel Space Observatory (Pilbratt et al. 2010) in the framework of the open time key program (OTKP) “TNOs are cool: a survey of the transneptunian region” (Müller et al. 2009) with the PACS instrument (Poglitsch et al. 2010) and a geometric albedo has been derived for the first time.
In this paper we present new spectroscopic data of (55638) 2002 VE95 obtained with ISAAC (1.1–1.4 microns) in 2007 and SINFONI (1.5–2.4 microns) in 2007 and 2008 together with all the available data (visible spectra and photometry) obtained quasi simultaneous to the near-infrared observations. Using the new constraints of the albedo value, we model the complete set of new available spectra as well the previous published data to investigate the surface composition properties and search for surface variation.
2. ESO-VLT observations and data reduction
Spectroscopy in the J band (1.1–1.4 μm) was obtained using the SW mode of the ISAAC instrument (equipped with a Rockwell Hawaii 1024 × 1024 pixel Hg:Cd:Te array), mounted at the unit 1 (Antu) of the VLT. The spectral resolution is about 500 with a 1″ slit. The observations were executed by nodding the object along the slit by 10″ between two positions A and B. We firstly used the ESO ISAAC pipeline (which runs through EsoRex, the “ESO Recipe Execution Tool”) for flat-fielding, wavelength calibration, correction for spatial and spectral axis distortion, and shifting and adding of the frames. The resulting combined spectrum of the object was then extracted using ESO-MIDAS. The reflectivity of (55638) 2002 VE95 was obtained by dividing its spectrum by that of the solar analog star Land93-101, observed at similar airmass. The spectrum was finally smoothed with a median filter technique, with a box of 9 Å in the spectral direction and a threshold of 15%.
Observational circumstances.
Spectroscopy in the H and K bands was obtained using the SINFONI instrument in the unit 4 (Yepun) of the VLT1. All these data were reduced using the SINFONI pipeline version 2.0.0, released by ESO. The reduction followed that described in Barucci et al. (2011). Particular attention was given to the sky-subtraction by adopting a performed procedure (Davies 2007) to improve the spectra. The reduction process produces data-cubes, in which the spatial information lies in the x-y space and the spectral one along the z axis. Once the cubes are sky-subtracted, they are combined to obtain the final science cube. The spectra are then extracted using a cylindrical aperture of five spaxels. The spectra of the object were then divided by that of a solar analog star (Land 93-101, observed both in 2007 and 2008) observed the same night at the same airmass and with the same setup. The spectra of the analog star were extracted using the same aperture as the science object to minimize possible systematic geometric effects.
The extraction of the reduced spectra was performed optimizing the aperture size (see Barucci et al. 2011 for details). The new obtained spectra of 2007 and 2008 with ISAAC and SINFONI together with the visible spectra (Fornasier et al. 2009) along with the obtained photometry (Perna et al. 2010) are shown in Fig. 1 as well as previous results published by Barucci et al. (2006). All observational circumstances are summarized in Table 1.
3. Herschel/PACS observations and data reduction
2002 VE95 was also observed by the Herschel Space Observatory in the framework of the OTKP “TNOs are cool!” (Müller et al. 2009). According to the OTKP observation strategy, the target was observed with the PACS detector (Poglitsch et al. 2010) of the Herschel Space Observatory (Pilbratt et al. 2010) in mini-scanmap mode at two epochs, separated by a time interval that corresponds to a movement of ~30′′ of the target, allowing for an optimal background subtraction. At each epoch the target was observed twice in the “blue” (nominal wavelegths of 70 μm) and in the “green” (100 μm) band, using two different scan position angles (red channel – 160 μm – data are always taken in parallel, either with the blue or the green channel). This forms a series of four measurements in the blue and green bands, and a series of eight measurements in the red band for a specific target.
(55638) 2002 VE95 was observed on August 12, 2010 at two epochs separated by ~16 h, following the OTKP observation strategy. The Herschel/PACS data were reduced with the modified and optimized version of the standard mini-scanmap data reduction pipeline in HIPE2 (Version 8.0.1761). The reliabilitly of the OTKP pipeline was checked by reducing standard star measurements, and comparing their obtained fluxes to the corresponding model predictions. A more detailed description of the data reduction pipeline and the related data products will be published in Kiss et al. (in prep.).
We obtained the following fluxes for (55638) 2002 VE95 in the 70, 100 and 160 μm PACS bands: F(70) = 10.4 ± 0.8 mJy, F(100) = 8.5 ± 1.1 mJy, F(160) = 6.9 ± 1.6 mJy.
4. Spectral analysis
The visible spectrum, carried out in 2007, was used to generate a complete spectrum from 0.4 to 2.3 μm with the two near-infrared spectra obtained in 2007 and 2008. To extract the complete reflectance spectra and to connect the different bands, we used the photometry presented in Table 2. All available spectra of (55638) 2002 VE95 are reported in Table 3 and Fig. 1. Like in Barucci et al. (2006), we were unable to obtain exactly simultaneous photometry and spectroscopy of the two different data sets, and our adjustments of the two parts (visible+near-infrared) are probably not optimal because different areas of the surface were observed.
We compare the spectra in Fig. 2 for the visible range and Fig. 3 for the near-infrared range. A comparison was also done in J band between the two available spectra. Variation are very small and inside the noise. In the visible range, the slope is different between the two spectra (see Fig. 2). The division of the visible spectrum obtained in 2007 by that of 2004 gives a quasi constant slope of about +6.5%/100 nm on the entire 0.43–0.85 μm range. No absorption bands are present in this part of the spectra.
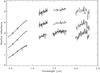 |
Fig. 1 All spectra of (55638) 2002 VE95 obtained with SINFONI, FORS and ISAAC from 2003 to 2008. From top to bottom: spectrum obtained with the visible spectrum (Fornasiet et al. 2009) and near-infrared spectrum obtained in November 2008, spectrum with the near-infrared spectrum obtained in December 2007 and finally, the V+NIR spectrum from Barucci et al. (2006). The reflectance is nominally normalized at 1 at 0.55 microns. Gray dots and error bars are the results of photometry obtained with FORS in the visible and ISAAC in the near-infrared. Spectra were shifted by +2, +1 and +0 unit in reflectance for clarity. |
Summary of the available observations of (55638) 2002 VE95.
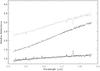 |
Fig. 2 Spectra of (55638) 2002 VE95 in the visible as observed and their comparison. The first one from the top is the spectrum from 2004 (normalized at 0.55 microns) reported as a dotted line (shifted by +1.6 in reflectance for clarity), then the one of 2007, in a continuous line (shifted by +0.8 unit in reflectance for clarity) while the spectrum on the bottom with overimposed straight line is the division of the second spectrum by the first one and the linear fit performed to compute the mean slope variation. The surface observed in 2007 is redder than that observed in 2004. |
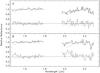 |
Fig. 3 Spectra of (55638) 2002 VE95 in the near-infrared and the relative spectral variations. Dashed lines represent the error bars, computed as the standard deviation in each wavelength range (i.e. corresponding to the H and K spectroscopic wavelength range). All spectra are normalized at 1.65 microns. Part A: comparison of the spectra obtained in the near-infrared range between October 2003 (in the top panel as a dashed line) and December 2007 (in the top panel as a continuous line). On the bottom part, shifted by −0.6 unit, the result of the division of the two spectra does not show obvious spectral variations and the slope variation is almost 0 from the linear fit (in continuous line from end to end of the spectral range). Part B: comparison of the spectra obtained in the near infrared range between October 2003 (in the top panel as a dashed line) and November 2008 (in the top panel as a continuous line). In the bottom part, shifted by −0.6 unit, the result of the division of the two spectra shows small variations near 1.5 and 2.05 microns but the slope variation is still very close to 0 from the linear fit. |
In the near-infrared, comparisons between spectra obtained in December 2007 and October 2003 (A) and spectra obtained in November 2008 and October 2003 (B) show a heterogeneity of the surface (see Fig. 3). Indeed, in the first case, the slope difference is almost 0 and the spectra are almost similar with variations no larger than 10% in H band and 15% in K band (see Fig. 3, part A). This could be bacause the same or almost same part of the object was observed. In the second case, there is also a very small slope variation (0.6%/100 nm, see Fig. 3, part B), but variations in terms of absorption bands is more obvious even if the noise of the Nov. 2008 near-infrared spectrum is higher (variations of 10% in H band and around 20% in K band).
To obtain some quantitative information from the spectra we computed the depth 2 μm value to characterize the spectra apriori. We computed the fractional difference in flux at 2.0 μm with respect to that at 1.7 μm. This parameter is defined as  (1)which gives us an idea of the possible amount of water ice present on the object’s surface. We computed a depth D(%) of 10.9 ± 3.2 for the observations in 2007 and 4.9 ± 2.5 for the observations in 2008.
Results (in %) and size (in μm) on the composition and physical parameters obtained with the Hapke model.
5. Thermal model and albedo value
Mommert et al. (2012) analyzed a sample of plutinos observed by Herschel, including also (55638) 2002 VE95. The Near-Earth Asteroid Thermal Model (NEATM, Harris 1998) was used to fit the measured Spitzer MIPS and Herschel PACS fluxes (see Mommert et al. 2012 for details). The temperature distribution follows the instantaneous equilibrium of a smooth surface with solar input, but is modified by a factor η (the beaming parameter), which empirically mimicks the combined effects of thermal inertia and surface roughness. A gray emissivity of 0.9 was assumed when calculating the local temperatures and monochromatic fluxes. Diameter and geometric albedo are furthermore related through the following relationship: 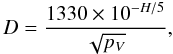 (2)where D is the asteroid diameter in km, pV is the geometric albedo, and H is the absolute V magnitude.
To derive best estimates of D, pV and η, we applied a χ2 minimization technique to find the best fit of the model spectral energy distribution to the measured flux densities, taking into account their 1 − σ uncertainties.
A diameter Deff = 249.8 km with a geometric albedo pV = 0.149
 was derived for 2002 VE95. The radiometric solutions are based on a fitted η-value of 1.40
 and lead to a χ2 very close to 1.0, indicating a very robust solution for the size and the albedo. This η-value agrees well with η-value of other Plutinos and the η = 1.2 average value provided by Stansberry et al. (2008).
6. Results: model fits
To investigate the surface properties of this object, we used the radiative transfer model developed by Hapke (1981; 1993). The composition and physical parameters were obtained following the work described in Merlin et al. (2010a). In that work, neglecting the interferences and simplifying the computation at zero phase angle, the geometric albedo is defined as  (3)where w is the single-scattering albedo and r0 is the bihemispherical reflectance. The w parameter depends on the optical constants of the material and is described in Hapke (1981). B0 is the ratio of the near-surface contribution to the total particle scattering at zero phase and P(0) is the phase function, approximated by a single Henyey-Greenstein function. See Merlin et al. (2010a) for a complete explanation. To investigate the surface composition, we used a set of identified or possible compounds for which optical constants are available. The general approach is to use the chemical compounds that can account for the present signatures, and plausible compounds that can reproduce the general spectral behavior for these distant objects. The code allows iterating with varying components, quantities and grain sizes with a minimization of the chi square between the model and the observed data.
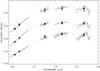 |
Fig. 4 Three different spectra of (55638) 2002 VE95 are reported in gray and the spectral models in black. The spectra are presented in the same order as in Fig. 1 (from the top to the bottom 2008, 2007, and 2006). Continuous and dashed dark lines represent the synthetic spectrum obtained with the Hapke model. Continuous and dashed parts represent, the ranges at which the model was computed and the ranges which are just completed respectively. Visible and near-infrared photometry were converted in reflectance (black filled circles with errors). The top two spectra were shifted by +0.2 and +0.4 unit for clarity. |
We ran models considering amorphous and crystalline water ice (Grundy & Schmitt 1998), olivine and pyroxene (Jager et al. 1994), triton, titan and ice tholins (Khare et al. 1986; 1993), methanol (Cruikshank et al. 1998), methane (Quirico & Schmitt 1997), amorphous carbon (Zubko et al. 1996) and kaolinite (Merlin et al. 2010b). Results of the best-fit models for the three different spectra of this object are reported in Table 4, which contains the percentage of the different components and particle size in microns. The results were obtained using the albedo value in the V band computed from Herschel observations (pV = 0.149 ) and presented on Fig. 4. All three models confirm the presence of water and methanol ices on the surface, as already stated in Barucci et al. (2006) from different models and assumptions on different albedo. Fine grains of titan and triton tholins seem to be the best candidates to reproduce the red slope, and amorphous carbon and olivine, could also be present. We emphasize that optical constants of tholins are obtained at low spectral resolution and with a rough accuracy. Their use in modeling can lead to some discrepancies, especially around 0.7–0.9 and 1.7 μm for titan tholin and around 2–2.2 μm for triton tholin. Optical constants of crystalline and amorphous water ice are only available from 0.63 μm. We reproduced the optical constants at shorter wavelengths (0.4–0.63 μm) since the absorption coefficient of water ice remains very low in this wavelength range. Small errors (within a few percent) are expected only for large particle size. The spectra do not show any obvious absorption feature of crystalline water ice (observed at 1.65 μm). This agrees with the results obtained with the spectral models that do not require water ice in its crystalline state. However, without a better S/N ratio and statistical studies such as those led by Merlin et al. (2010a), this material cannot be completely ruled out (a similar explanation is also true for small amounts of pyroxene and ice tholin, see limits of models presented in Barucci et al. 2008).
7. Discussion
Comparisons of the different spectra and models agree with a moderate heterogeneous surface. Our confidence level is lower for the fit performed for the spectrum obtained by Barucci et al. (2006) but this is mainly caused by to the differences between the fit and this spectrum in the visible range where the S/N level is higher. The fit in the near-infrared part is better and corresponds to the wavelength range where the diagnostic of the signatures relative to the ices is possible. From the comparison of the different spectra, we were able to observe two different parts of the surface, with color and chemical variegation. The texture, mixture properties, or the grain size of the surface may play a role in the V − R color and the difference may be more physical than chemical in this wavelength range. Our results agree with those found for fine particles in Merlin et al. (2010a) for other TNOs. Without clear absorption bands, it is difficult to firmly state the chemical properties of this object. Nevertheless, organic materials such as triton and titan tholins seem to be the best candidates among other materials such as amorphous carbon and olivine (minor contribution), or pyroxene and ice tholin, which we also used as input in our models. This object is not big (~250 km) and it is relatively small among the TNOs where ices have been clearly identified. It seems to be covered by different icy compounds, such as water and methanol. The water ice amount is clearly evident from the spectral features and detected from models even if it is still low (less than 20% or close to 5% when the particle size is close to 100 μm for the given albedo). In the three cases, absorption bands are present at 2.0 and near 2.3 microns in the K spectroscopic range, assuming a mixture of water and methanol ices. In all cases, CH3OH seems to be in comparable amount to water ice, which makes this object different compared to most icy TNOs, for which the detected ice is mainly water ice (see Barucci et al. 2011).
Following the results obtained by Ortiz et al. (2006) and Thirouin et al. (2010) on the short-term rotational variability of this object, it is not possible to investigate the relation between our spectral results and the rotational phase of this Plutino. While our observations were taken over a five-year period, the rotation phase uncertainties become too large after a few months and do not allow us to give constraints on the most probable rotation period.
Because the absorption features relative to H2O and CH3OH ices are detected in all three different epoch observations, we can argue from a statistical point of view that these two ices should be present at different rotation phases and are not localized in a specific area. This idea is also supported by the recent scenario for the evaporation and remaining of volatiles by Brown et al. (2011), who found a relation between physical (red and bright objects) and chemical properties (presence of hydrocarbons). This scenario suggests that objects that were formed further inside the disk (approximately beyond 20 AU) can retain hydrocarbons and particularly methanol on their surface in addition to H2O (also identified here) and CO2 (barely identifiable with the S/N and the spectral resolution of our spectra).
8. Conclusions
We presented new near-infrared spectra of a very red plutino object obtained in two different oppositions (2007 and 2008). We compared the new obtained spectra with the previous available observations. A heterogeneity was detected. Using the new available albedo determined with the space telescope Herschel, the surface model was presented for the new and the previously published data. The object clearly contains on its surface CH3OH, H2O as well as titan and triton tholins with percentage that is different depending on the observed surface. Few traces of olivine and amorphous carbon can also be present in some area of the body, but we were unable to firmly detect these compounds without unambiguous absorption features. This object is among the reddest objects of the TNO and Centaur population, with spectral characteristics very similar to (5145) Pholus (Cruikshank et al. 1998) and (90377) Sedna (Barucci et al. 2010b). Pholus is a Centaur, while Sedna is a detached object with a very distant aphelion (931 AU). These three very red objects, part of completely different dynamical classes, seem to have a very similar composition, even if Sedna has a more significant variation on the surface with hydrocarbon ices in some cases, which better fits the spectra that show small varying traces of CH4 and N2. (55638) 2002 VE95 is also very different in surface composition from all other observed plutinos (see Barucci et al. 2011).
That methanol ice seems to be present mainly on very red surface favors the hypothesis that surfaces of objects of the RR taxonomical class are more primordial. Indeed, the evidence that methanol could indicate a chemically primitive nature of this body was confirmed by its abundance on many active comets (Bockelée-Morvan et al. 2004) and in the interstellar medium (Wooden et al. 2004). Laboratory irradiation experiments (Brunetto et al. 2006) where the irradiated methanol crust retains a higher albedo and redder surfaces also support this.
More details of the instrument can be found at www.eso.org
HIPE is a joint development by the Herschel Science Ground Segment Consortium, consisting of ESA, the NASA Herschel Science Center, and the HIFI, PACS and SPIRE consortia.
Acknowledgments
C.K. acknowldeges the support of the PECS program of the European Space Agency (ESA) and the Hungarian Space Office (PECS-98073), and the support of the Bolyai Research Fellowship of the Hungarian Academy of Sciences. P.S.S. acknowledges finantial support by the Centre National de la Recherche Scientifique (CNRS).
References
- Barucci, M. A., Merlin, F., Dotto, E., et al. 2006, A&A, 455, 725 [NASA ADS] [CrossRef] [EDP Sciences] [Google Scholar]
- Barucci, M. A., Brown, M. E., Emery, J. P., & Merlin, F. 2008, In The Solar System Beyond Neptune, ed. M. A. Barucci et al. (Univ. of Arizona Press), 143 [Google Scholar]
- Barucci, M. A., Alvarez-Cantal, A., Belskaya I., et al. 2010a, The Messenger 141, 15 [Google Scholar]
- Barucci, M. A., Morea DalleOre, C., Alvarez-Candal, A., et al. 2010b, AJ, 140, 2095 [NASA ADS] [CrossRef] [Google Scholar]
- Barucci, M. A., Alvarez-Candal, A., Merlin, F., et al. 2011, Icarus, 214, 297 [NASA ADS] [CrossRef] [Google Scholar]
- Bockelée-Morvan, D., Biver, N., Colom, P., et al. 2004, Icarus, 167, 113 [NASA ADS] [CrossRef] [Google Scholar]
- Brown, M. E., Schaller, E. L., & Fraser, W. C. 2011, ApJ, 739, L60 [NASA ADS] [CrossRef] [Google Scholar]
- Brunetto, R., Barucci, M. A., Dotto, E., et al. 2006, ApJ, 644, 646 [NASA ADS] [CrossRef] [Google Scholar]
- Cruikshank, D. P., Roush, T. L., Bartholomew, M. J., et al. 1998, Icarus, 135, 389 [NASA ADS] [CrossRef] [Google Scholar]
- Davies, R. I. 2007, MNRAS, 375, 1099 [NASA ADS] [CrossRef] [Google Scholar]
- Fornasier, S., Barucci, M. A., de Bergh, C., et al. 2009, A&A, 508, 457 [NASA ADS] [CrossRef] [EDP Sciences] [Google Scholar]
- Fulchignoni, M., Belskaya, I., Barucci, M. A., et al. 2008, in The Solar System beyond Neptune, ed. M. A. Barucci, et al. (Univ. of Arizona Press), 181 [Google Scholar]
- Grundy, W. M., & Schmitt, B. 1998, J. Geophys. Res., 103, 25809 [NASA ADS] [CrossRef] [Google Scholar]
- Hapke, B. 1981, J. Geophys. Res., 86, 4571 [NASA ADS] [Google Scholar]
- Hapke, B. 1993, Theory of reflectance and emittance spectroscopy, Topics in Remote Sensing (Cambridge UK: Cambridge University Press) [Google Scholar]
- Harris, A. W. 1998, Icarus, 131, 291 [NASA ADS] [CrossRef] [EDP Sciences] [Google Scholar]
- Jager, C., Mutschke, H., Begemann, B., et al. 1994, A&A, 292, 641 [NASA ADS] [Google Scholar]
- Khare, B. N., Sagan, C., Ogino, H., et al. 1986, Icarus, 67, 176 [NASA ADS] [CrossRef] [PubMed] [Google Scholar]
- Khare, B. N., Thompson, W. R., Cheng, et al. 1993, Icarus, 103, 290 [NASA ADS] [CrossRef] [Google Scholar]
- Merlin, F., Barucci, M. A., de Bergh, C., et al. 2010a, Icarus, 208, 945 [NASA ADS] [CrossRef] [Google Scholar]
- Merlin, F., Barucci, M. A., de Bergh, C., et al. 2010b, Icarus, 210, 930 [NASA ADS] [CrossRef] [Google Scholar]
- Müller, T. G., Lellouch, E., Bohnhardt, H., et al. 2009, EM&P, 105, 209 [Google Scholar]
- Mommert, M., Harris, A. W., Kiss, C., et al. 2012, A&A, in press, DOI: 10.1051/0004-6361/201118562 [Google Scholar]
- Ortiz, J. L., Gutiérrez, P. J., Santos-Sanz, P., et al. 2006, A&A, 447, 1131 [NASA ADS] [CrossRef] [EDP Sciences] [Google Scholar]
- Perna, D., Barucci, M. A., Fornasier, S., et al. 2010, A&A, 510, A53 [NASA ADS] [CrossRef] [EDP Sciences] [Google Scholar]
- Pilbratt, G. L., Riedinger, J. R., Passvogel, T., et al. 2010, A&A, 518, L1 [CrossRef] [EDP Sciences] [Google Scholar]
- Poglitsch, A., Waelkens, C., Geis, N., et al. 2010, A&A, 518, L2 [NASA ADS] [CrossRef] [EDP Sciences] [Google Scholar]
- Quirico, E., & Schmitt, B. 1997, Icarus, 127, 354 [NASA ADS] [CrossRef] [Google Scholar]
- Stansberry, J., Grundy, W., Brown, M., et al. 2008, In The Solar System Beyond Neptune (Univ of Arizona Press), ed. M. A. Barucci, H. Boehnhardt, D. P. Cruikshank, & A. Morbidelli, Tucson, 161 [Google Scholar]
- Thirouin, A., Ortiz, J. L., Duffart, R., et al. 2010, A&A, 522, A93 [NASA ADS] [CrossRef] [EDP Sciences] [Google Scholar]
- Wooden, D. H., Woodward, C. E., & Harker, D. E. 2004, ApJ, 612, L77 [NASA ADS] [CrossRef] [Google Scholar]
- Zubko, V. G., Mennella, V., Colangeli, L., et al. 1996, Optical Constants of Amorphous Carbon Extracted from Recent Laboratory Extinction Measurements, The Role of Dust in the Formation of Stars, 333 [Google Scholar]
All Tables
Results (in %) and size (in μm) on the composition and physical parameters obtained with the Hapke model.
All Figures
|
Fig. 1 All spectra of (55638) 2002 VE95 obtained with SINFONI, FORS and ISAAC from 2003 to 2008. From top to bottom: spectrum obtained with the visible spectrum (Fornasiet et al. 2009) and near-infrared spectrum obtained in November 2008, spectrum with the near-infrared spectrum obtained in December 2007 and finally, the V+NIR spectrum from Barucci et al. (2006). The reflectance is nominally normalized at 1 at 0.55 microns. Gray dots and error bars are the results of photometry obtained with FORS in the visible and ISAAC in the near-infrared. Spectra were shifted by +2, +1 and +0 unit in reflectance for clarity. |
| In the text | |
|
Fig. 2 Spectra of (55638) 2002 VE95 in the visible as observed and their comparison. The first one from the top is the spectrum from 2004 (normalized at 0.55 microns) reported as a dotted line (shifted by +1.6 in reflectance for clarity), then the one of 2007, in a continuous line (shifted by +0.8 unit in reflectance for clarity) while the spectrum on the bottom with overimposed straight line is the division of the second spectrum by the first one and the linear fit performed to compute the mean slope variation. The surface observed in 2007 is redder than that observed in 2004. |
| In the text | |
|
Fig. 3 Spectra of (55638) 2002 VE95 in the near-infrared and the relative spectral variations. Dashed lines represent the error bars, computed as the standard deviation in each wavelength range (i.e. corresponding to the H and K spectroscopic wavelength range). All spectra are normalized at 1.65 microns. Part A: comparison of the spectra obtained in the near-infrared range between October 2003 (in the top panel as a dashed line) and December 2007 (in the top panel as a continuous line). On the bottom part, shifted by −0.6 unit, the result of the division of the two spectra does not show obvious spectral variations and the slope variation is almost 0 from the linear fit (in continuous line from end to end of the spectral range). Part B: comparison of the spectra obtained in the near infrared range between October 2003 (in the top panel as a dashed line) and November 2008 (in the top panel as a continuous line). In the bottom part, shifted by −0.6 unit, the result of the division of the two spectra shows small variations near 1.5 and 2.05 microns but the slope variation is still very close to 0 from the linear fit. |
| In the text | |
|
Fig. 4 Three different spectra of (55638) 2002 VE95 are reported in gray and the spectral models in black. The spectra are presented in the same order as in Fig. 1 (from the top to the bottom 2008, 2007, and 2006). Continuous and dashed dark lines represent the synthetic spectrum obtained with the Hapke model. Continuous and dashed parts represent, the ranges at which the model was computed and the ranges which are just completed respectively. Visible and near-infrared photometry were converted in reflectance (black filled circles with errors). The top two spectra were shifted by +0.2 and +0.4 unit for clarity. |
| In the text | |
Current usage metrics show cumulative count of Article Views (full-text article views including HTML views, PDF and ePub downloads, according to the available data) and Abstracts Views on Vision4Press platform.
Data correspond to usage on the plateform after 2015. The current usage metrics is available 48-96 hours after online publication and is updated daily on week days.
Initial download of the metrics may take a while.