Fig. 17
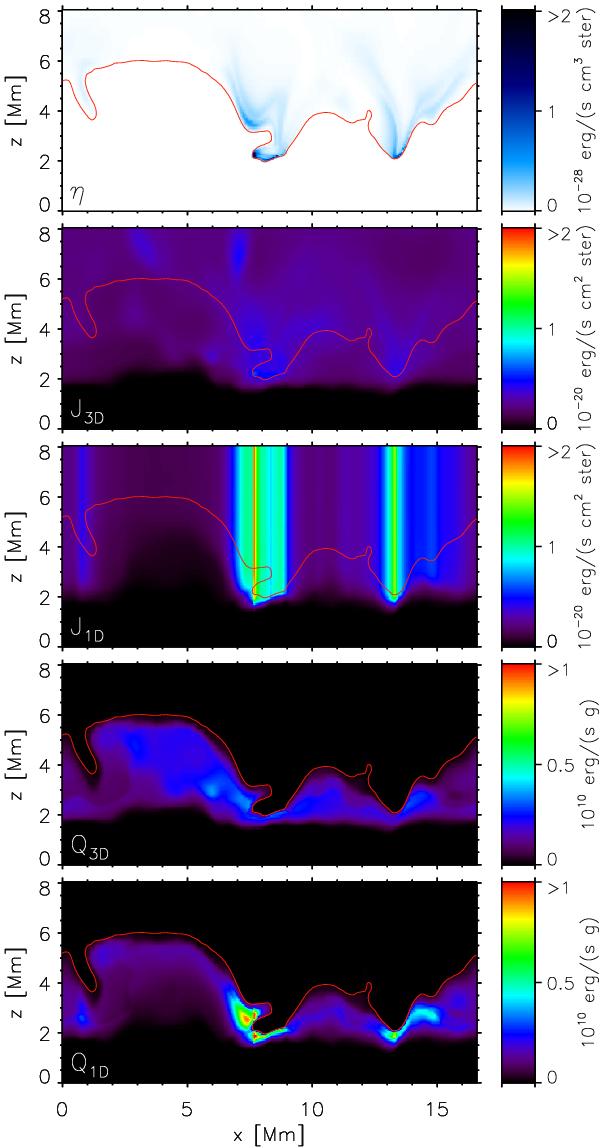
Comparison of the 1D and 3D method for computing chromospheric heating due to absorption of coronal radiation. All panels show a vertical slice through a snapshot of a three-dimensional radiation-MHD simulation performed with Bifrost. The red curve is located at a gas temperature of 30 000 K and indicates the location of the transition zone. All brightness ranges have been clipped to bring out variation at low values of the displayed quantities. Panels, from top to bottom: coronal emissivity η; angle-averaged radiation field computed in 3D; angle-averaged radiation field computed in 1D: heating rate per mass with 3D radiation: heating rate per mass with 1D radiation. Note that the 3D radiation field is computed using the full 3D volume, not only this 2D slice.
Current usage metrics show cumulative count of Article Views (full-text article views including HTML views, PDF and ePub downloads, according to the available data) and Abstracts Views on Vision4Press platform.
Data correspond to usage on the plateform after 2015. The current usage metrics is available 48-96 hours after online publication and is updated daily on week days.
Initial download of the metrics may take a while.