Fig. A.1
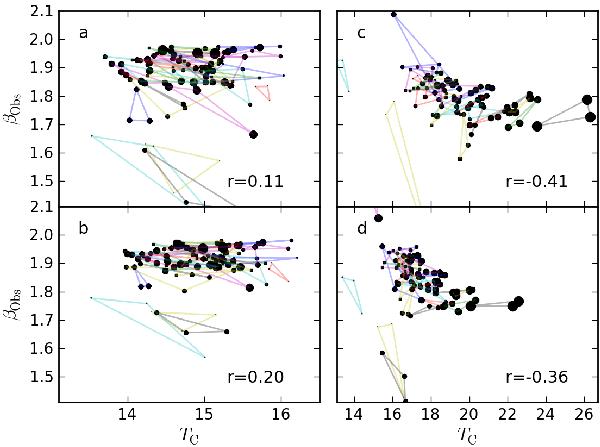
The observed spectral indices and colour temperatures towards the self-gravitating cores in a model presented in Malinen et al. (2011). The frames a) and b) show the situation without and the frames c and d) with heating sources inside the cores. The assumed cloud distance is 500 pc in frames a) and c) and 1 kpc in the frames b) and d). The symbol sizes correspond to the mass of the core (~1–39 M⊙). The surface brightness maps were calculated for three orthogonal directions. For each core, the lines (of random colour) connect the values obtained for three different directions of observation. The linear correlation coefficient between TC and βObs (including all the plotted points) is given in the lower right hand corner of each frame.
Current usage metrics show cumulative count of Article Views (full-text article views including HTML views, PDF and ePub downloads, according to the available data) and Abstracts Views on Vision4Press platform.
Data correspond to usage on the plateform after 2015. The current usage metrics is available 48-96 hours after online publication and is updated daily on week days.
Initial download of the metrics may take a while.