Fig. 5
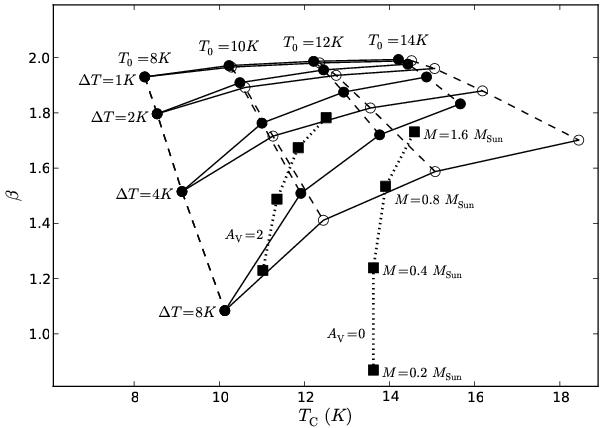
The dependence between TC and β for a model of two layers at temperatures T0 and T0 + ΔT, with a ratio 4:1 between the column densities. Each solid curve corresponds to a single value of ΔT, with T0 = 8, 10, 12, and 14 K along the dashed lines. The open symbols show corresponding results for column density ratios 4:1, 3:1, 2:1, and 1:1 for the T0 values of 8, 10, 12, and 14 K, respectively. The two dotted lines and the square symbols show the values for Bonnor-Ebert spheres of 0.2, 0.4, 0.8, and 1.60 M⊙ with no external shielding or spheres shielding by AV = 2m. In this figure, the 100 μm intensities were not used.
Current usage metrics show cumulative count of Article Views (full-text article views including HTML views, PDF and ePub downloads, according to the available data) and Abstracts Views on Vision4Press platform.
Data correspond to usage on the plateform after 2015. The current usage metrics is available 48-96 hours after online publication and is updated daily on week days.
Initial download of the metrics may take a while.