Fig. 4
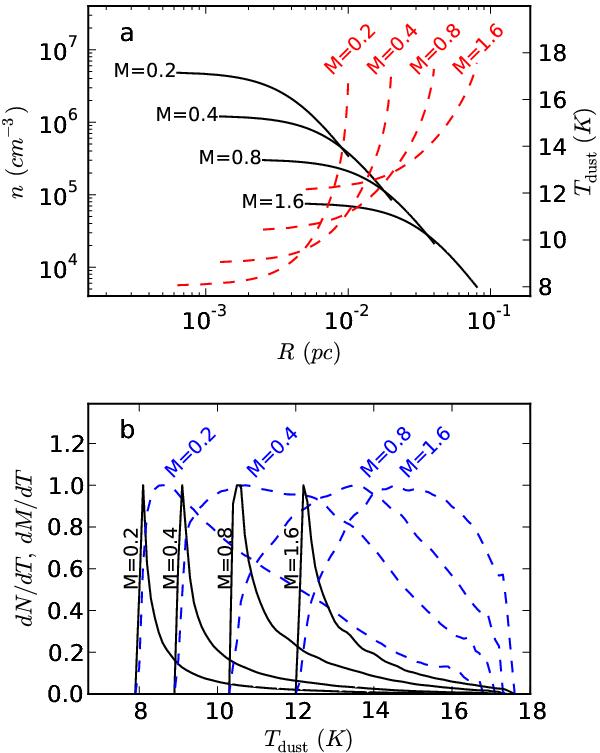
Frame a) the radial density profiles (solid curves and the scale on the left) and the temperature profiles (dashed curves and the scale on the right) for Bonnor-Ebert spheres of 0.2, 0.4, 0.8, and 1.6 M⊙ (curves from left to right). Frame b) the probability distributions of the column density as the function of the dust temperature for a line-of-sight through the centre of the cloud (solid lines). The curves correspond to the 0.2, 0.4, 0.8, and 1.6 M⊙ models, from left to right. The dashed lines show the corresponding probability distributions for the total dust mass of the model cloud. All the probability distributions have been normalised to a maximum value of 1.0.
Current usage metrics show cumulative count of Article Views (full-text article views including HTML views, PDF and ePub downloads, according to the available data) and Abstracts Views on Vision4Press platform.
Data correspond to usage on the plateform after 2015. The current usage metrics is available 48-96 hours after online publication and is updated daily on week days.
Initial download of the metrics may take a while.