Fig. 3
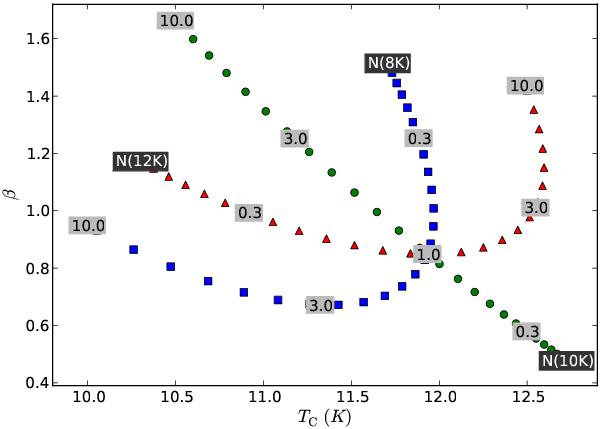
As Fig. 1 but for three layers at 8 K, 10 K and 12 K. The central point corresponds to identical mass in each temperature component and the curves are obtained by scaling the relative mass of one component at a time. For the component that is being modified, the temperature is indicated in the figure (black labels) and the relative mass is shown for a few positions along the resulting curves (gray labels). All components have the same spectral index, β = 2.0.
Current usage metrics show cumulative count of Article Views (full-text article views including HTML views, PDF and ePub downloads, according to the available data) and Abstracts Views on Vision4Press platform.
Data correspond to usage on the plateform after 2015. The current usage metrics is available 48-96 hours after online publication and is updated daily on week days.
Initial download of the metrics may take a while.