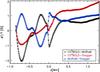
Fig. 4
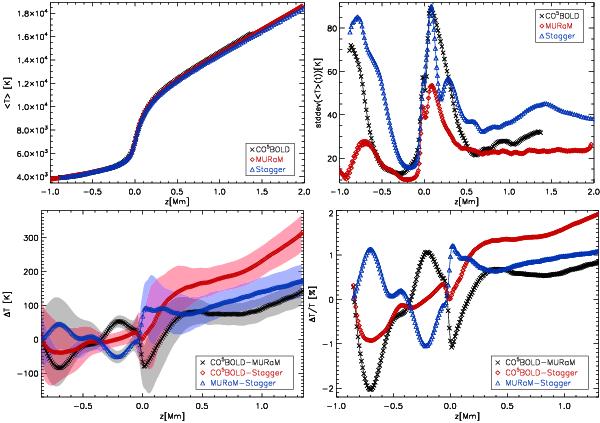
Upper panels: horizontally averaged temperature (left) and standard deviation of the mean temperature profiles corresponding to the 19 simulation snapshots (right) as functions of geometrical depth (z = 0: average depth of τ500 = 1). Lower panels: absolute (left) and relative (right) mean temperature differences between the models.
Current usage metrics show cumulative count of Article Views (full-text article views including HTML views, PDF and ePub downloads, according to the available data) and Abstracts Views on Vision4Press platform.
Data correspond to usage on the plateform after 2015. The current usage metrics is available 48-96 hours after online publication and is updated daily on week days.
Initial download of the metrics may take a while.