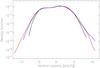
Fig. 3
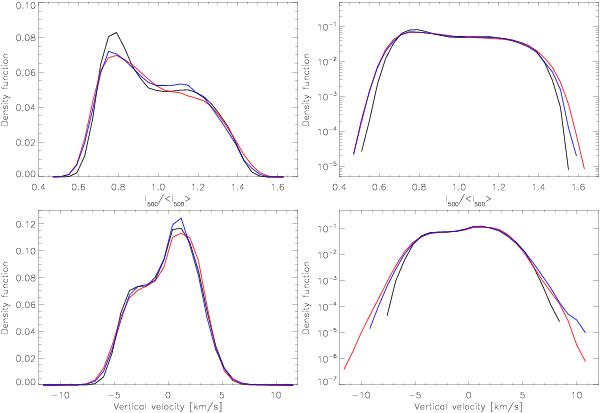
Linear (left) and logarithmic (right) histograms of the vertically emerging continuum intensity at 500 nm (upper panels) and the vertical velocity on the average height level of the surface τ500 = 1 (lower panels) averaged over all 19 snapshots from each simulation (black: CO5BOLD, red: MURaM, blue: Stagger). Positive velocities correspond to upflows. Thirty bins were used in all cases. Each histogram was normalized such that the sum of the density function over the bins becomes unity.
Current usage metrics show cumulative count of Article Views (full-text article views including HTML views, PDF and ePub downloads, according to the available data) and Abstracts Views on Vision4Press platform.
Data correspond to usage on the plateform after 2015. The current usage metrics is available 48-96 hours after online publication and is updated daily on week days.
Initial download of the metrics may take a while.