Free Access
Fig. 2
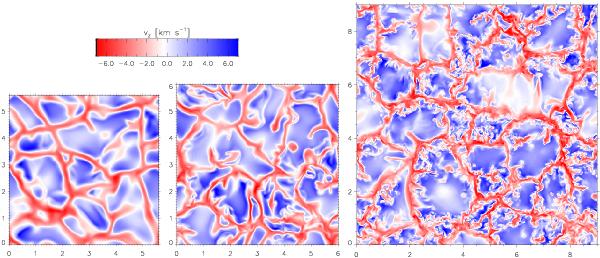
Vertical velocity at the average geometrical depth level of the surface τ500 = 1 for the same snapshots as in Fig. 1. Downflows are shown in red, upflows in blue. The color table covers the range ± 7 km s-1 in all cases; speeds outside this range are saturated. Axis units are Mm.
Current usage metrics show cumulative count of Article Views (full-text article views including HTML views, PDF and ePub downloads, according to the available data) and Abstracts Views on Vision4Press platform.
Data correspond to usage on the plateform after 2015. The current usage metrics is available 48-96 hours after online publication and is updated daily on week days.
Initial download of the metrics may take a while.