Fig. 6
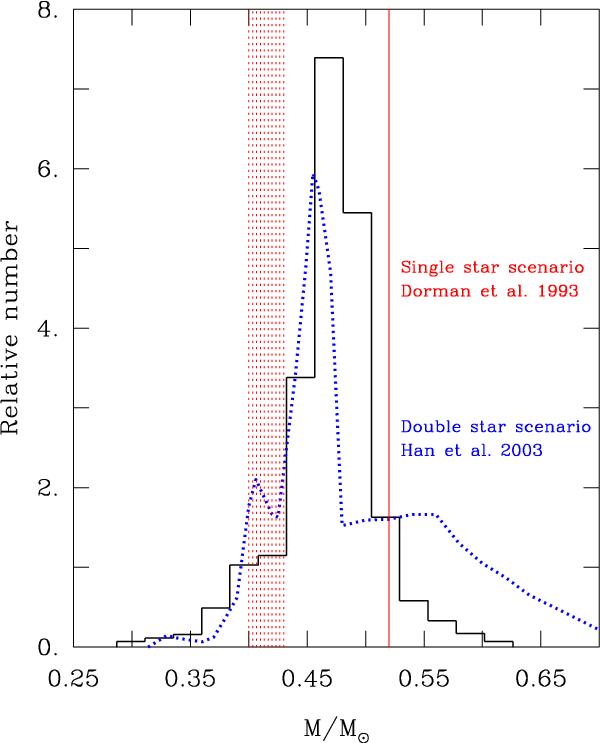
Comparison of the empirical mass distribution of sdB stars based on our full sample of 22 stars (histogram) with the range of possible masses predicted by single star evolution according to Dorman et al. (1993); the red lines mark the (sharp) upper and (fuzzy) lower boundaries of this range. Another comparison is provided by the blue curve which shows one of the predicted mass distributions of sdB stars due to binary evolution according to Han et al. (2003). The blue curve has been normalized such that the area under it is equal to the area occuped by the histogram (corresponding to the total number of stars in the sample).
Current usage metrics show cumulative count of Article Views (full-text article views including HTML views, PDF and ePub downloads, according to the available data) and Abstracts Views on Vision4Press platform.
Data correspond to usage on the plateform after 2015. The current usage metrics is available 48-96 hours after online publication and is updated daily on week days.
Initial download of the metrics may take a while.